 机器学习初学者


类似MATLAB方法:使用 matplotlib.pyplot;
面向对象方法:主要使用matplotlib.figure.Figure和matplotlib.axes.Axes。本文介绍Matplotlib图形组成 (基于面向对象方法),通过本文基本能掌握Matplotlib面向对象绘图法常用操作, 文末如果有人点赞、在看~~,会尽快更新下一篇:图解Matplotlib(pyplot法)~~。
废话不多说,上效果图,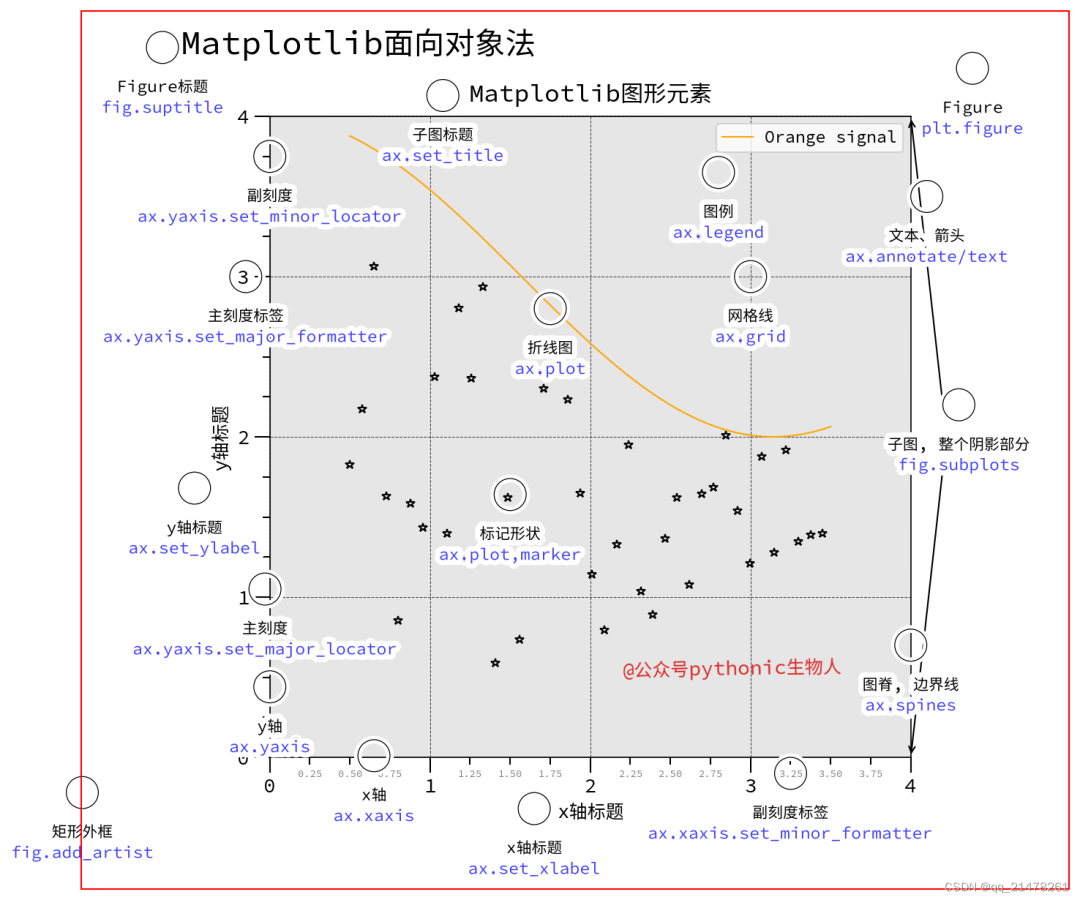
上图参考了matplotlib.org,pythonic生物人做了很多修改,以便于人能看懂。 通过上图可以轻松学会 Figure、title、subplot、axis、grid、legend、ticker、patches、annotate、artist、text等使用。图中蓝色字体的大部分方法之前都详细介绍过👉Python可视化笔记43篇合集
上代码,
#!/usr/bin/env python
# -*- encoding: utf-8 -*-
'''
转载请标明来源!转载请标明来源!转载请标明来源!
@Time    :   2022年五一劳动节
@Author  :   matplotlib.org,公众号:pythonic生物人
@Contact :   公众号:pythonic生物人
@Desc    :   图解Matplotlib面向对象方法
'''

# 导入模块
import numpy as np
import matplotlib.pyplot as plt
from matplotlib.patches import Circle, Rectangle
from matplotlib.patheffects import withStroke
from matplotlib.ticker import AutoMinorLocator, MultipleLocator

# 指定字体
from mplfonts import use_font

use_font('Source Han Mono SC')

# 添加画布Figure,图中红框包围的部分为一个Figure
fig = plt.figure(figsize=(9, 8), facecolor='1', dpi=150)

# 为Figure添加标题
fig.suptitle('Matplotlib面向对象法', x=0.46, fontsize=20, ha='right')

# 在Figure上添加子图Axes
marg = 0.15
ax = fig.add_axes([marg, marg, 1 - 1.8 * marg, 1 - 1.8 * marg],
                  aspect=1,
                  facecolor='0.9')

# 准备绘图数据
np.random.seed(19680801)
X = np.linspace(0.5, 3.5, 120)
Y1 = 3 + np.cos(X)
Y2 = 1 + np.cos(1 + X / 0.75) / 2
Y3 = np.random.uniform(Y1, Y2, len(X))

# 同一个axes上绘图
ax.plot(X, Y1, c='orange', lw=1, label="Orange signal", zorder=10)
ax.plot(X[::3],
        Y3[::3],
        linewidth=0,
        markersize=6,
        marker='*',
        markerfacecolor='none',
        markeredgecolor='black',
        markeredgewidth=1)

# 设置子图标题
ax.set_title("Matplotlib图形元素", fontsize=15, verticalalignment='bottom')

# 设置图例
ax.legend(loc="upper right", fontsize=10)

# 设置坐标轴标题
ax.set_xlabel("x轴标题", fontsize=12)
ax.set_ylabel("y轴标题", fontsize=12)

# 设置x,y轴刻度间隔
ax.xaxis.set_major_locator(MultipleLocator(1.000))  # x轴主刻度间隔
ax.xaxis.set_minor_locator(AutoMinorLocator(4))  # x轴副刻度间隔

ax.yaxis.set_major_locator(MultipleLocator(1.000))
ax.yaxis.set_minor_locator(AutoMinorLocator(4))


# 设置x轴副刻度格式
def minor_tick(x, pos):
    if not x % 1.0:
        return ""
    return f"{x:.2f}"


ax.xaxis.set_minor_formatter(minor_tick)

# 设置x,y轴刻度范围
ax.set_xlim(0, 4)
ax.set_ylim(0, 4)

# 设置x,y轴刻度字号、颜色等
ax.tick_params(which='major', width=1.0, labelsize=12)
ax.tick_params(which='major', length=10, labelsize=12)
ax.tick_params(which='minor', width=1.0, labelsize=10)
ax.tick_params(which='minor', length=5, labelsize=6, labelcolor='0.5')

# 设置网格线
ax.grid(linestyle="--", linewidth=0.5, color='.25', zorder=-10)

# 文本、箭头
ax.annotate(
    "",
    xy=(4, 4),
    xytext=(4.2, 2.2),
    color=(0.25, 0.25, 1.00),
    weight="regular",
    arrowprops=dict(arrowstyle="->", connectionstyle="arc3", color="black"),
)

ax.annotate(
    "",
    xy=(4, 0),
    xytext=(4.2, 1.8),
    color=(0.25, 0.25, 1.00),
    weight="regular",
    arrowprops=dict(arrowstyle="->", connectionstyle="arc3", color="black"),
)

# 矩形外框
fig.add_artist(
    Rectangle((0, 0),
              width=1,
              height=1,
              facecolor='none',
              edgecolor='red',
              linewidth=1.0))


# 图中添加圆圈注释
def just_circle(x, y, radius=0.15):
    c = Circle((x, y),
               radius,
               clip_on=False,
               zorder=10,
               linewidth=0.6,
               edgecolor='black',
               facecolor='none',
               path_effects=[withStroke(linewidth=5, foreground=(1, 1, 1, 1))])
    ax.add_artist(c)


# 图中添加文本注释
def text(x, y, text):
    ax.text(x,
            y,
            text,
            zorder=100,
            ha='center',
            va='top',
            weight='bold',
            color='black',
            style='italic',
            path_effects=[withStroke(linewidth=7, foreground=(1, 1, 1, 1))])


# 图中添加Matplotlib对应方法文本
def code(x, y, text):
    ax.text(x,
            y,
            text,
            zorder=100,
            ha='center',
            va='top',
            weight='normal',
            color=(0.25, 0.25, 1.00),
            fontsize='medium',
            path_effects=[withStroke(linewidth=7, foreground=(1, 1, 1, 1))])


def circle(x, y, txt, cde, radius=0.1):
    just_circle(x, y, radius=radius)
    text(x, y - 0.2, txt)
    code(x, y - 0.33, cde)


circle(4.385, 4.3, "Figure", "plt.figure")
circle(4.3, 2.2, "子图, 整个阴影部分", "fig.subplots")

circle(-0.67, 4.43, "Figure标题", "fig.suptitle")
circle(1.08, 4.13, "子图标题", "ax.set_title")

circle(1.75, 2.80, "折线图", "ax.plot")
circle(1.5, 1.64, "标记形状", "ax.plot,marker")
circle(3.00, 3.00, "网格线", "ax.grid")
circle(2.8, 3.65, "图例", "ax.legend")

circle(-0.03, 1.05, "主刻度", "ax.yaxis.set_major_locator")
circle(-0.15, 3.00, "主刻度标签", "ax.yaxis.set_major_formatter")
circle(0.00, 3.75, "副刻度", "ax.yaxis.set_minor_locator")
circle(3.25, -0.10, "副刻度标签", "ax.xaxis.set_minor_formatter")

circle(0.65, 0.01, "x轴", "ax.xaxis")
circle(0, 0.44, "y轴", "ax.yaxis")
circle(1.650, -0.32, "x轴标题", "ax.set_xlabel")
circle(-0.47, 1.68, "y轴标题", "ax.set_ylabel")

circle(4.0, 0.7, "图脊, 边界线", "ax.spines")
circle(-1.17, -0.22, "矩形外框", "fig.add_artist")

circle(4.1, 3.5, "文本、箭头", "ax.annotate/text")

plt.show()往期精彩回顾
适合初学者入门人工智能的路线及资料下载 (图文+视频)机器学习入门系列下载 中国大学慕课《机器学习》(黄海广主讲) 机器学习及深度学习笔记等资料打印 《统计学习方法》的代码复现专辑 机器学习交流qq群955171419,加入微信群请扫码: