 小詹学Python


今日小编继续给大家推荐优质绘图工具,帮助小伙伴们更好的是实现不同领域中可视化作品的快速绘制。今天的主角为R-grafify包,其包含5大类共19种可视化图表,舒适和符合出版要求的配色更是为这个可视化包填色,下面就通过以下两个方面介绍下整个优质可视化工具。
R-grafify介绍 R-grafify样例介绍
R-grafify介绍
这一部分小编重点放在R-grafify可绘制的5大类可视化图表和颜色搭配上,内容如下:
5大类可视化图表
R-grafify包可绘制的19种图表主要可分为以下5个小类:
Two variables、 Three or four variables、 Numeric X-Y Plots、 Before-after Plots Data distributions
下面的样例介绍部分,小编将进行具体介绍~~
颜色搭配
R-grafify 包有其自己独有的颜色搭配设计,这里直接列出其所有的颜色条,如下图所示:
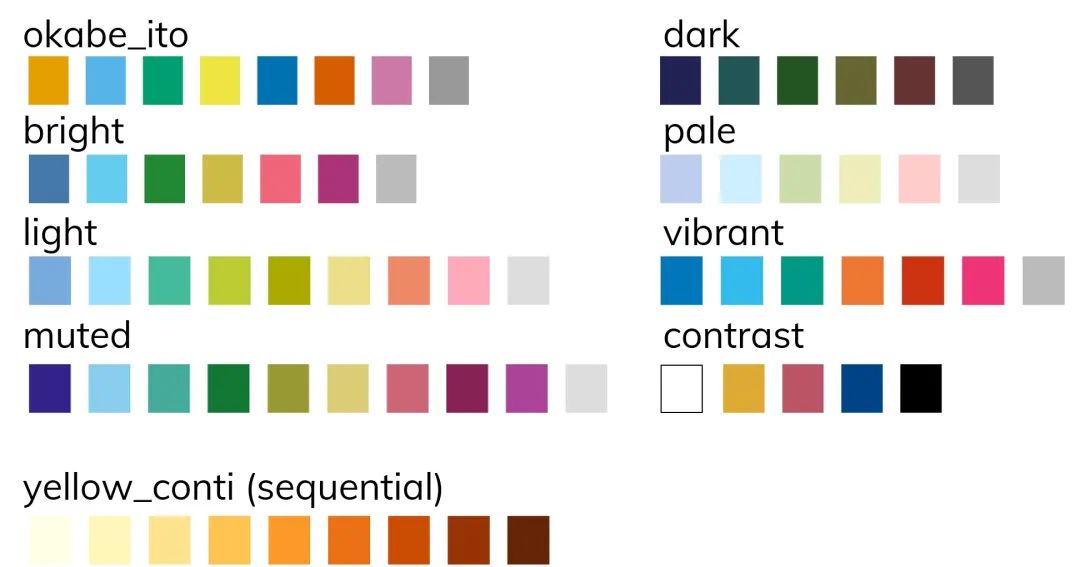
你可以像使用ggplot2种的scale_fill... 和scale_colour... 函数一样使用R-grafify包的颜色名称进行颜色选择和设置。
R-grafify样例介绍
这一部分小编将对上述列举过的5大类图表进行一一介绍(有的类样例较多,将介绍几个典型的图表类型),详细内容如下:
Two variables
这一小类所含图表类型较多,这里小编简单列举3个样例,如下:
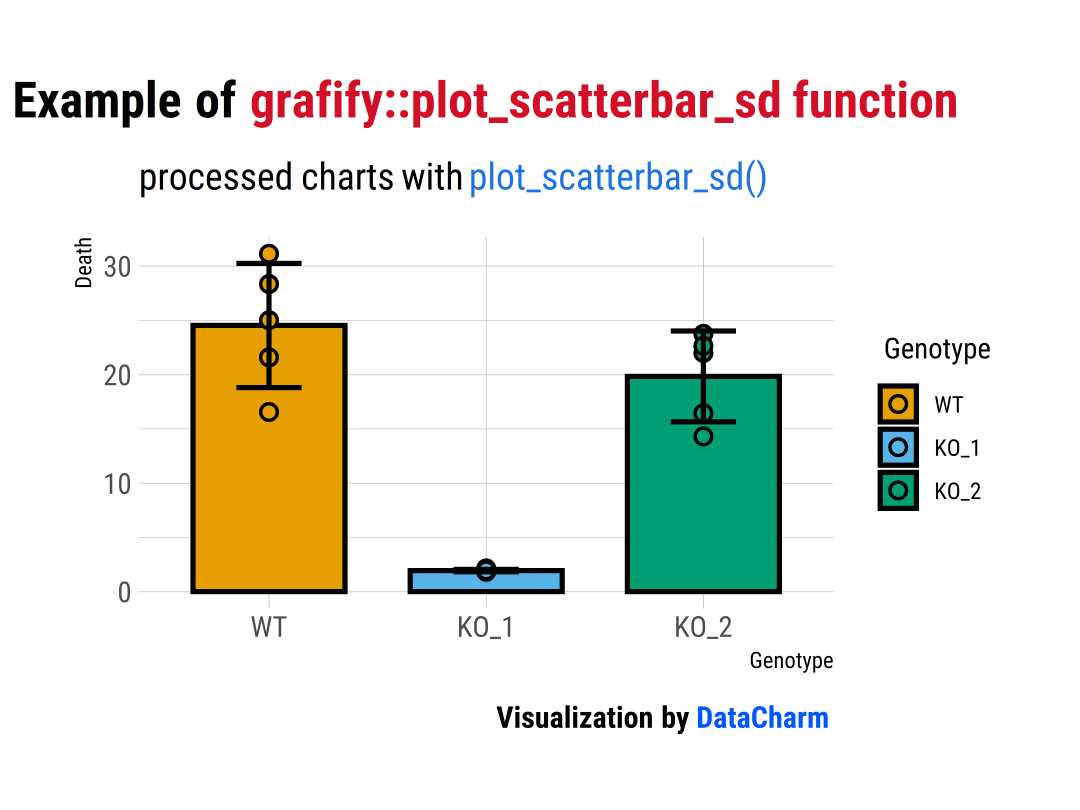
plot_scatterbar_sd()
plot_scatterbar_sd(data = data_1w_death, #data table
                             xcol = Genotype,      #X variable
                             ycol = Death)+        #Y variable
  hrbrthemes::theme_ipsum(base_family = "Roboto Condensed") +
  labs(
    title = "Example of <span style='color:#D20F26'>grafify::plot_scatterbar_sd function</span>",
    subtitle = "processed charts with <span style='color:#1A73E8'>plot_scatterbar_sd()</span>",
    caption = "Visualization by <span style='color:#0057FF'>DataCharm</span>") +
  theme(
    plot.title = element_markdown(hjust = 0.5,vjust = .5,color = "black",
                                  size = 20, margin = margin(t = 1, b = 12)),
    plot.subtitle = element_markdown(hjust = 0,vjust = .5,size=15),
    plot.caption = element_markdown(hjust = 1,face = 'bold',size = 12))
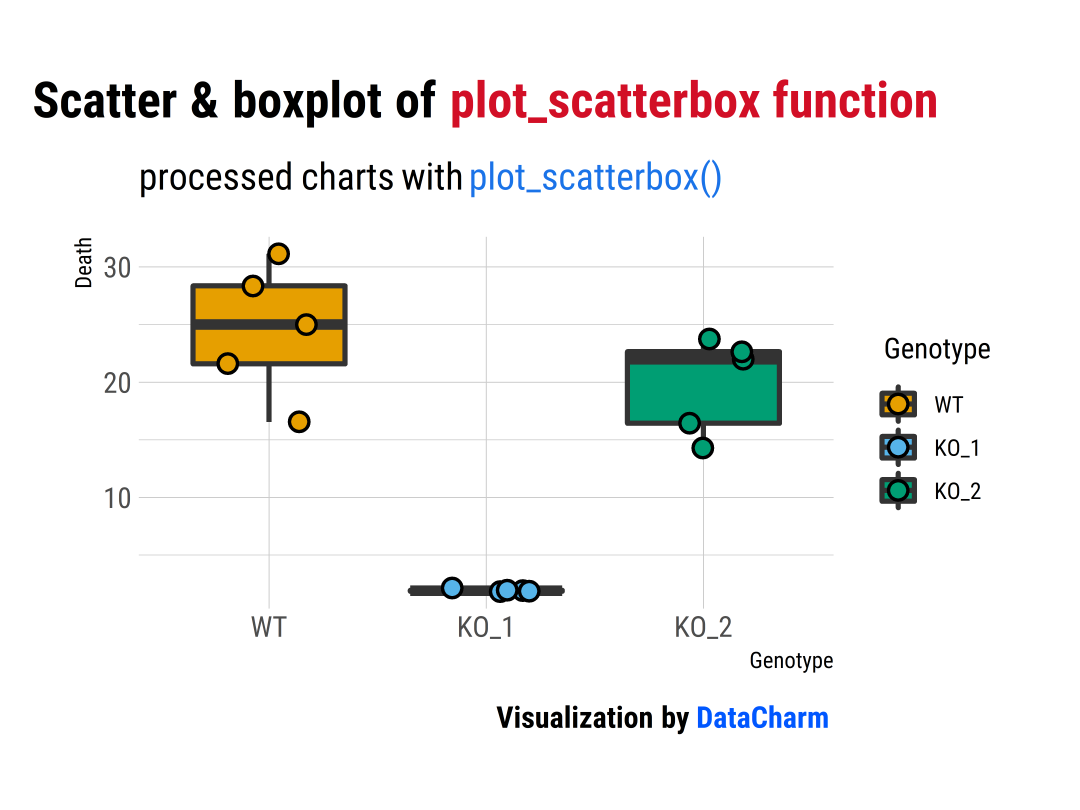
plot_scatterbox()
plot_scatterbox(data_1w_death,    #data table
            Genotype,         #X variable
            Death,            #Y variable
            symsize = 3,      #larger symbols
            jitter = 0.2)
plot_point_sd()
plot_point_sd(data_1w_death,
            Genotype,
            Death,
            symsize = 6,     #larger symbols
            ewid = 0.2,      #narrower error bars
            ColPal = "bright", #"bright" palette
            ColRev = F) +
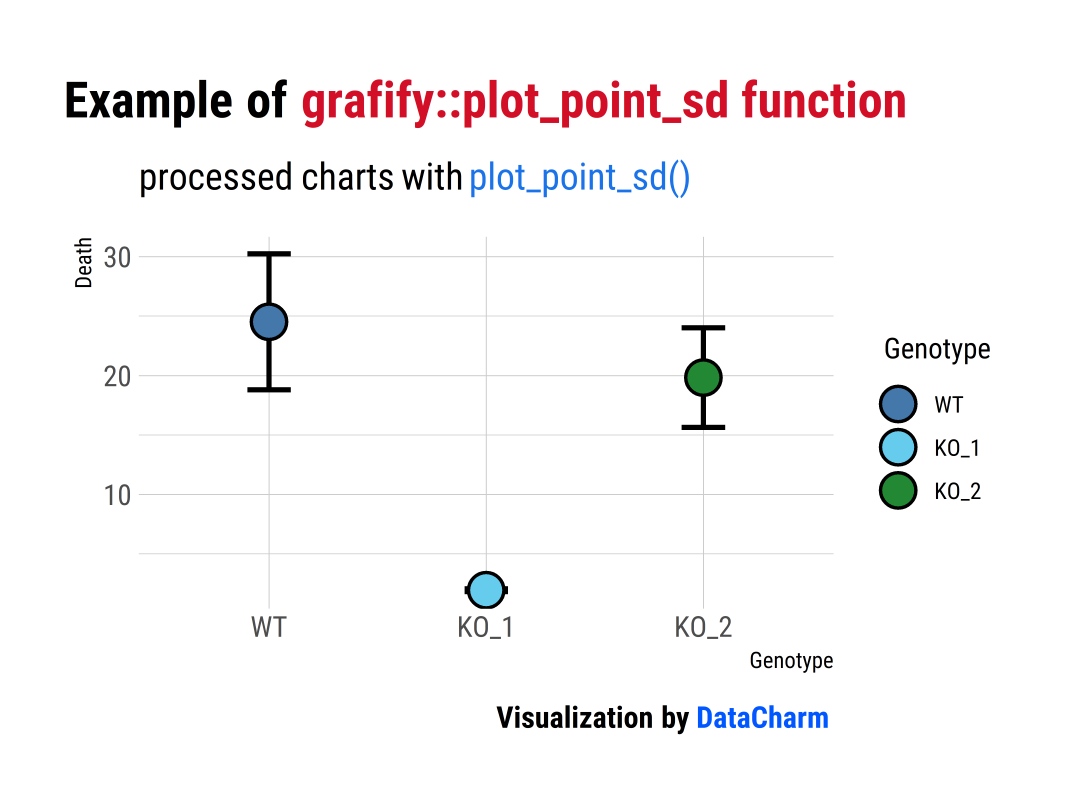
「注意」:这里更改了颜色条:ColPal = "bright",且ColRev设置成False。
Three or four variables
这类图表包含plot_3d_scatterbar(), plot_3d_scatterbox(), plot_4d_scatterbar(), plot_4d_scatterbox() 函数,具体如下:
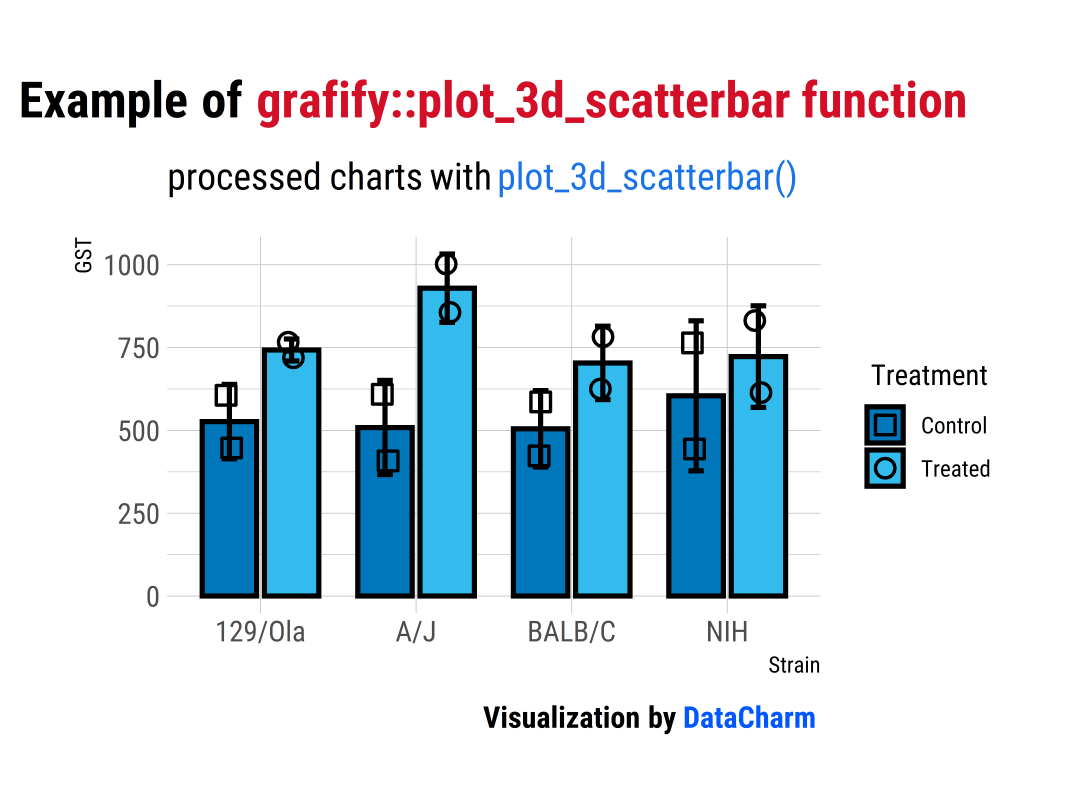
plot_3d_scatterbar()
plot_3d_scatterbar(data_2w_Festing,     #data table
                   Strain,           #X variable
                   GST,                 #Y variable
                   shapes = Treatment,
                   symsize = 3,         #grouping factor for shapes
                   ColPal = "vibrant") + #"vibrant" palette
hrbrthemes::theme_ipsum(base_family = "Roboto Condensed") +
  labs(
    title = "Example of <span style='color:#D20F26'>grafify::plot_3d_scatterbar function</span>",
    subtitle = "processed charts with <span style='color:#1A73E8'>plot_3d_scatterbar()</span>",
    caption = "Visualization by <span style='color:#0057FF'>DataCharm</span>") +
  theme(
    plot.title = element_markdown(hjust = 0.5,vjust = .5,color = "black",
                                  size = 20, margin = margin(t = 1, b = 12)),
    plot.subtitle = element_markdown(hjust = 0,vjust = .5,size=15),
    plot.caption = element_markdown(hjust = 1,face = 'bold',size = 12))
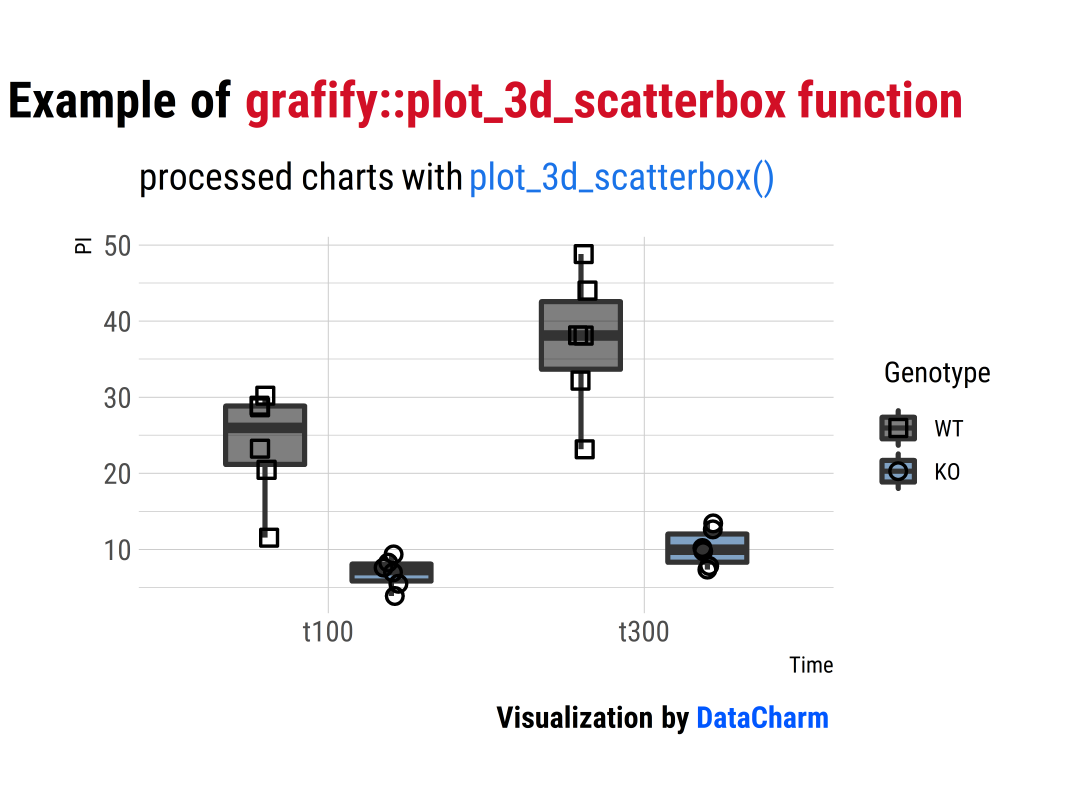
plot_3d_scatterbox()
plot_3d_scatterbox(data_2w_Tdeath,
                   Time,
                   PI,
                   Genotype,
                   b_alpha = 0.5,          #reduced opacity
                   ColPal = "contrast",  #"contrast" palette
                   ColRev = T)
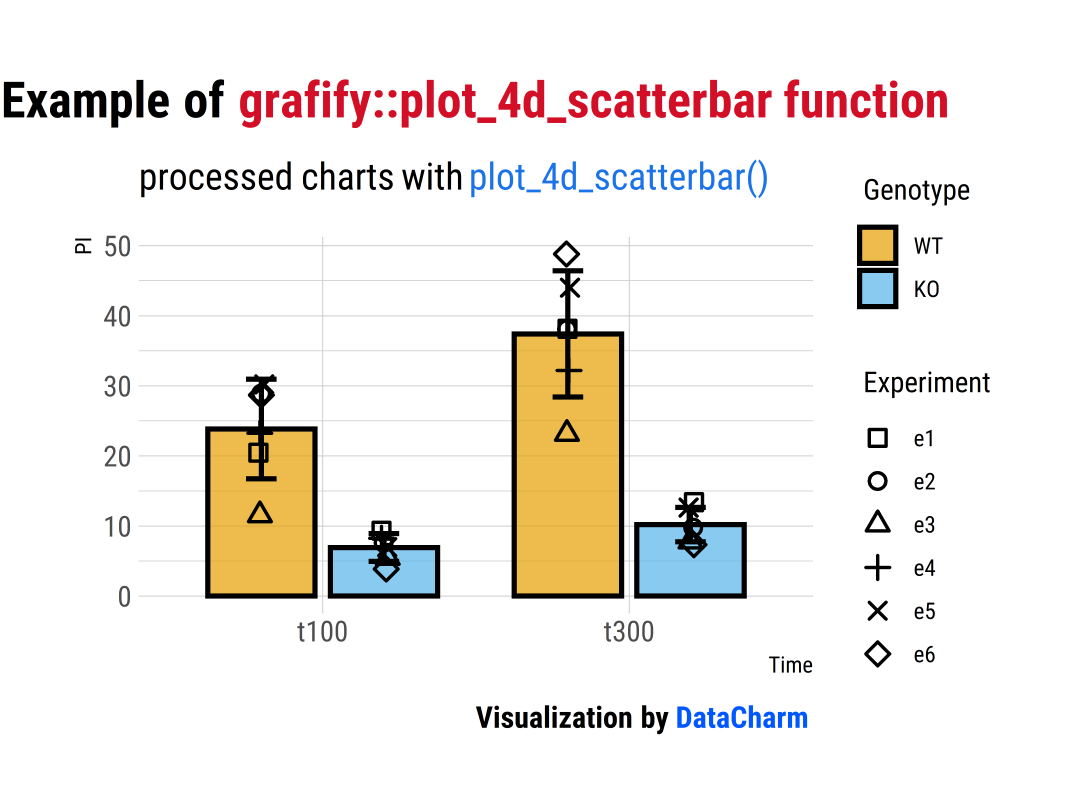
plot_4d_scatterbar()
plot_4d_scatterbar(data_2w_Tdeath,
                   Time,
                   PI,
                   Genotype,
                   Experiment,
                   b_alpha = 0.7,
                   ColPal = "okabe_ito")+
  scale_colour_manual(values = c("black", "grey20"))
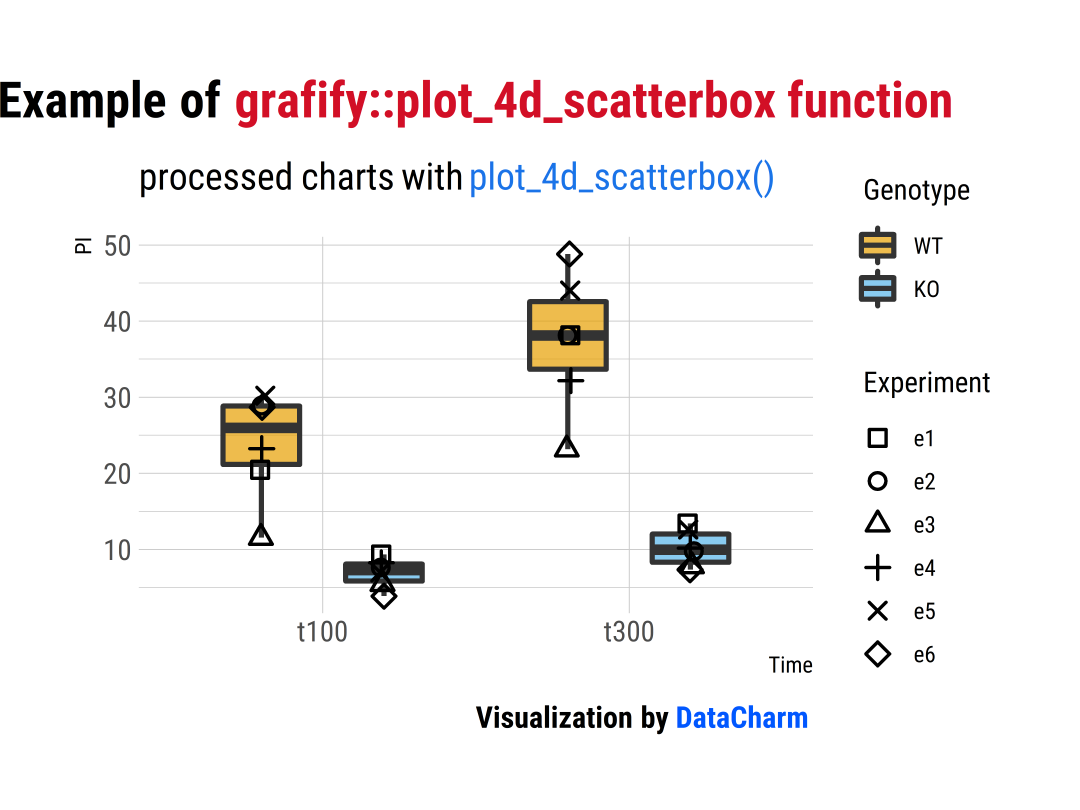
plot_4d_scatterbox()
plot_4d_scatterbox(data_2w_Tdeath,
                   Time,
                   PI,
                   Genotype,
                   Experiment,
                   b_alpha = 0.7,
                   ColPal = "okabe_ito")+
  scale_colour_manual(values = c("black", "grey20"))  #manual colour scale
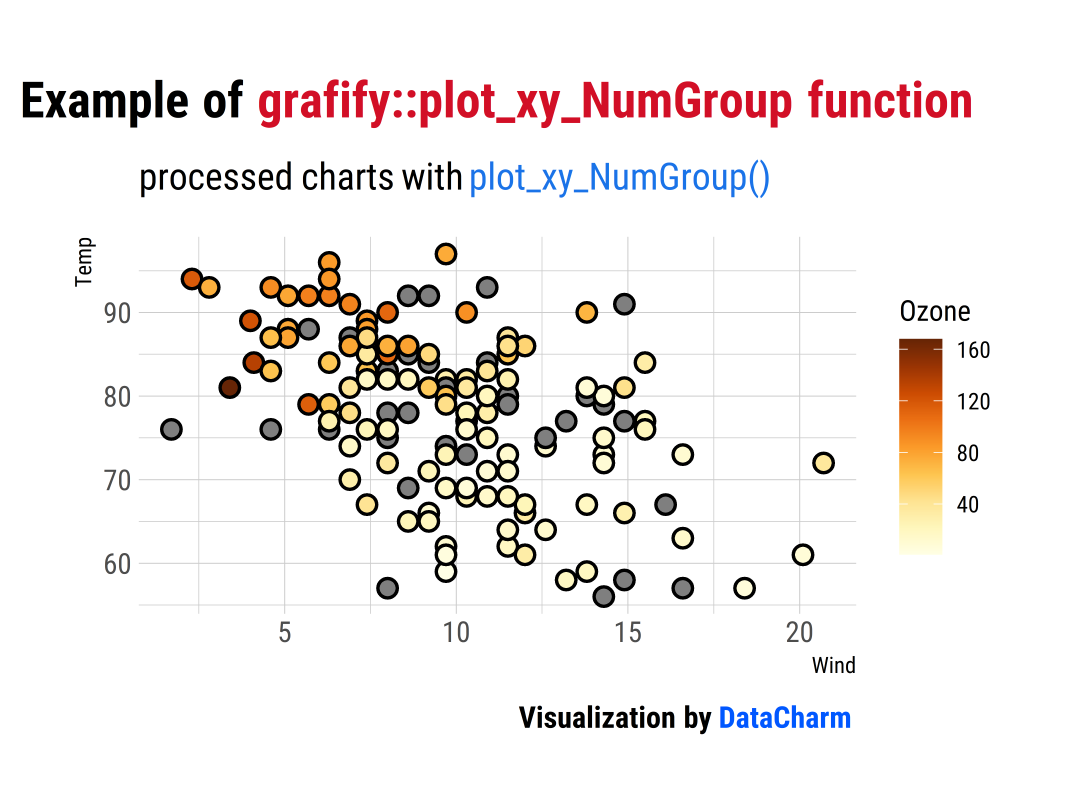
Numeric X-Y Plots
此类图表包含plot_xy_NumGroup(), plot_xy_CatGroup() 函数,具体如下:
plot_xy_NumGroup()
plot_xy_NumGroup(airquality,
                 Wind,
                 Temp,
                 Ozone,
                 symsize = 3)
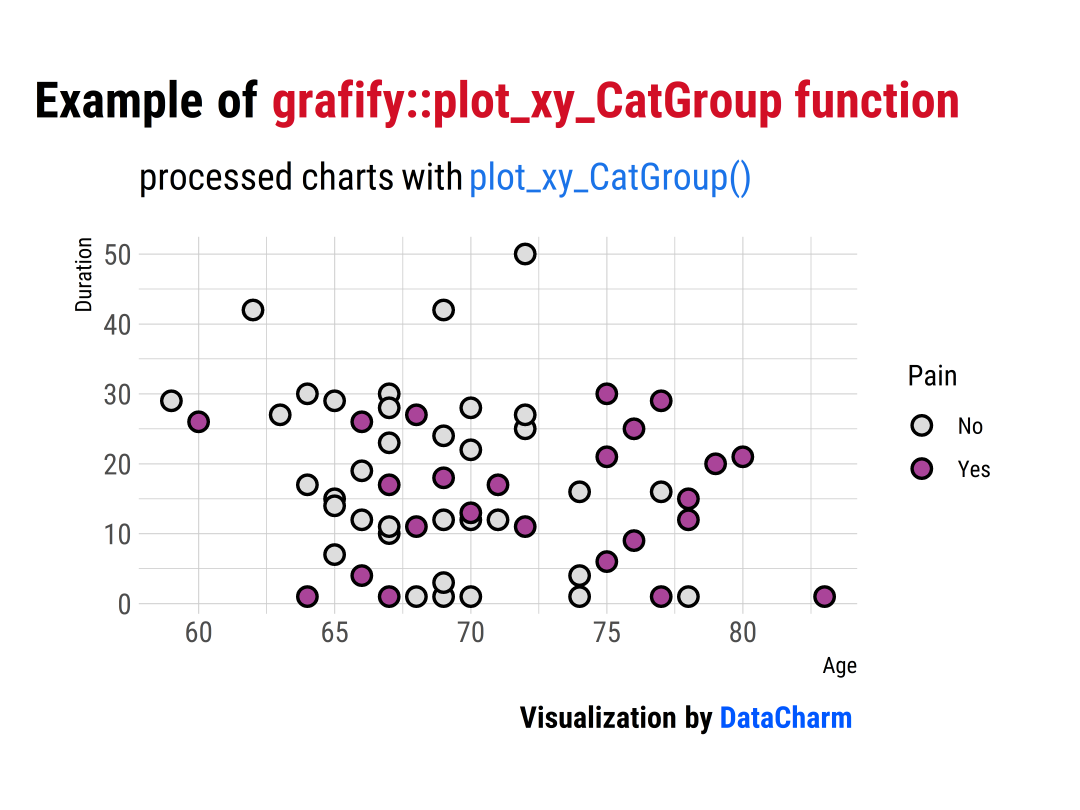
plot_xy_CatGroup()
plot_xy_CatGroup(neuralgia,
                 Age,
                 Duration,
                 Pain,
                 symsize = 3,
                 ColPal = "muted",     #palette
                 ColRev = T)
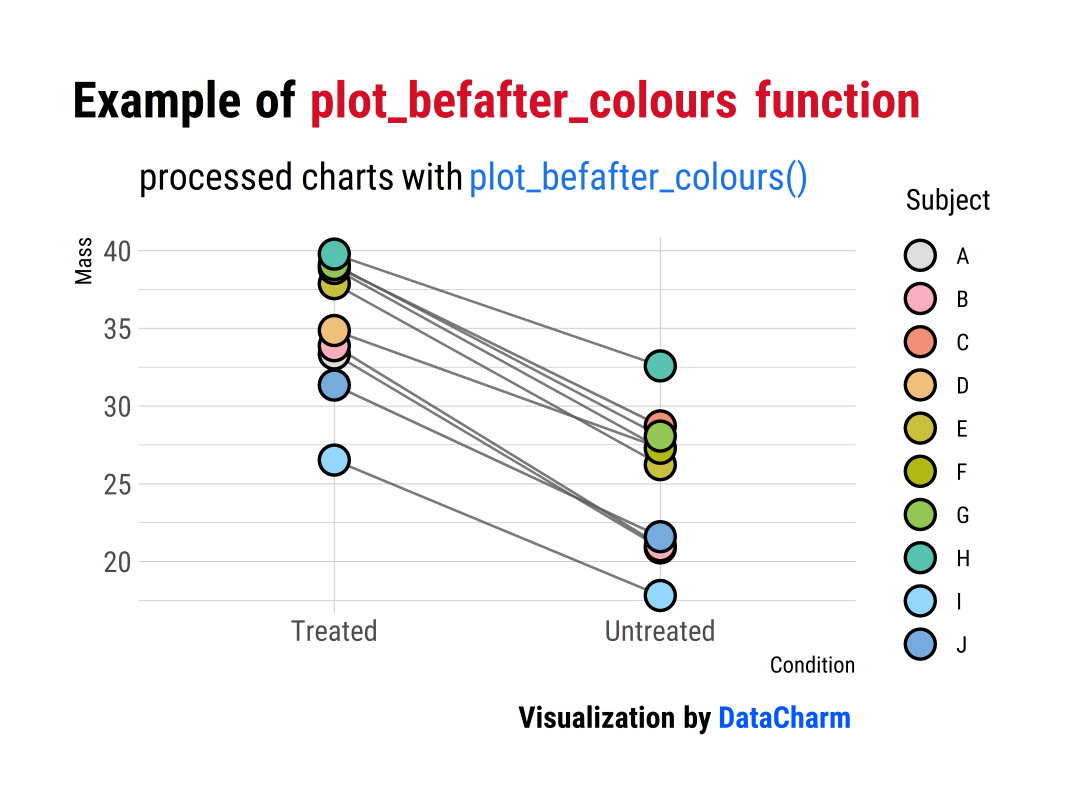
Before-after Plots
此类图表包含plot_befafter_colours() , plot_befafter_shapes() 函数,具体如下:
plot_befafter_colours()
plot_befafter_colours(data = data_t_pdiff,
                      xcol = Condition,
                      ycol = Mass,
                      groups = Subject,
                      symsize = 5,
                      ColPal = "light",
                      ColRev = T)
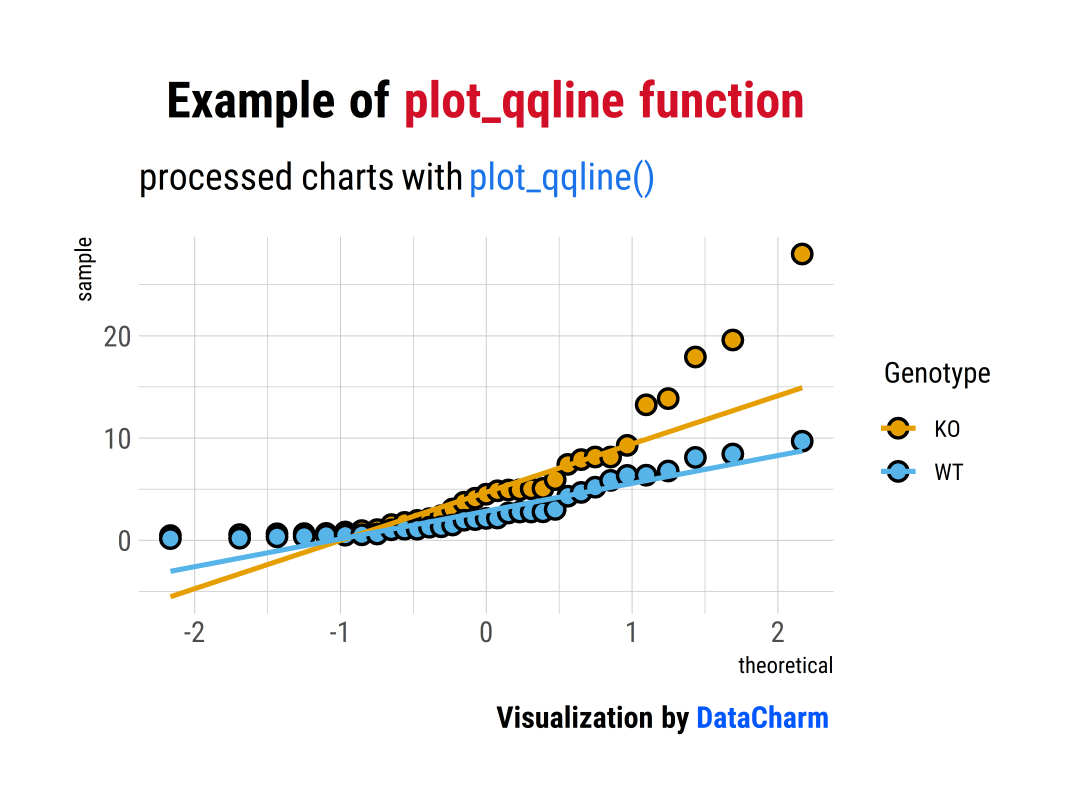
Data distributions
此类图表包含plot_qqline(), plot_density() 和plot_histogram() 函数,具体如下:
lot_qqline()
plot_qqline(data = data_t_pratio,
            ycol = Cytokine,
            xcol = Genotype)
以上就是小编关于R-grafify包的简单介绍,特别是对每种绘图函数所需数据的数据形式理解。更多关于该包参数和使用方法等介绍可参考R-grafify包官网[1]
总结
今天的推文小编简单介绍了R-grafify包的各种图表类型和颜色搭配,希望感兴趣的小伙伴可以进行相关科研图表 的绘制和对其颜色搭配 的参考~~
参考资料
R-grafify包官网: https://grafify-vignettes.netlify.app/。
E N D
各位伙伴们好,詹帅本帅假期搭建了一个个人博客和小程序,汇集各种干货和资源,也方便大家阅读,感兴趣的小伙伴请移步小程序体验一下哦!(欢迎提建议)
推荐阅读