
C/C++动态检测内存错误利器 - ASan
来自公众号:大胖聊编程
作者:大胖
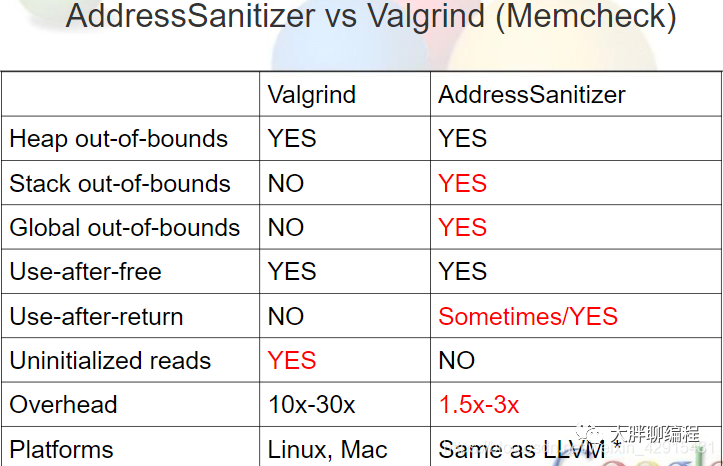
malloc函数的运行时库组成,在性能及检测内存错误方面都优于Valgrind,你值得拥有。
缓冲区溢出
① 堆内存溢出
② 栈上内存溢出
③ 全局区缓存溢出悬空指针(引用)
① 使用释放后的堆上内存
② 使用返回的栈上内存
③ 使用退出作用域的变量非法释放
① 重复释放
② 无效释放内存泄漏 初始化顺序导致的问题
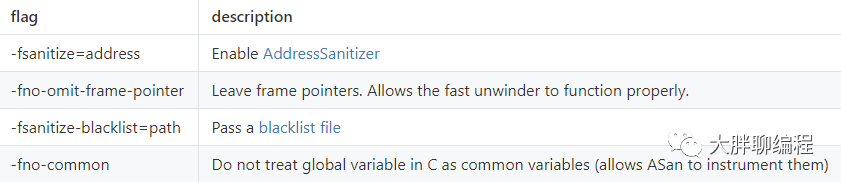
使用ASan时,只需gcc选项加上-fsanitize=address选项; 如果想要在使用asan的时候获取更好的性能,可以加上O1或者更高的编译优化选项; 想要在错误信息中让栈追溯信息更友好,可以加上-fno-omit-frame-pointer选项。 本文针对linux x86-64平台,gcc编译器环境实验。
[root@yglocal ~]# lsb_release -aLSB Version: :core-4.1-amd64:core-4.1-noarchDistributor ID: CentOSDescription: CentOS Linux release 8.1.1911 (Core)Release: 8.1.1911Codename: Core[root@yglocal ~]# uname -r4.18.0-147.el8.x86_64[root@yglocal ~]# gcc --versiongcc (GCC) 8.3.1 20190507 (Red Hat 8.3.1-4)Copyright (C) 2018 Free Software Foundation, Inc.This is free software; see the source for copying conditions. There is NOwarranty; not even for MERCHANTABILITY or FITNESS FOR A PARTICULAR PURPOSE
[root@localhost test]# gcc -g -O2 -fsanitize=address -fno-omit-frame-pointer hello.c/usr/bin/ld: cannot find /usr/lib64/libasan.so.0.0.0collect2: error: ld returned 1 exit status
[root@localhost test]# yum install libasan[root@yglocal asan_test]# vi heap_ovf_test.c#include#include#includeint main(){char *heap_buf = (char*)malloc(32*sizeof(char));memcpy(heap_buf+30, "overflow", 8); //在heap_buf的第30个字节开始,拷贝8个字符free(heap_buf);return 0;}
编译并运行:
[root@yglocal asan_test]# gcc -fsanitize=address -fno-omit-frame-pointer -o heap_ovf_test heap_ovf_test.c[root@yglocal asan_test]# ./heap_ovf_test===================================================================40602==ERROR: AddressSanitizer: heap-buffer-overflow on address 0x603000000030 at pc 0x7f3de8f91a1d bp 0x7ffd4b4ebb60 sp 0x7ffd4b4eb308WRITE of size 8 at 0x603000000030 thread T0#0 0x7f3de8f91a1c (/lib64/libasan.so.5+0x40a1c)#1 0x400845 in main (/root/asan_test/heap_ovf_test+0x400845)#2 0x7f3de8bb1872 in __libc_start_main (/lib64/libc.so.6+0x23872)#3 0x40075d in _start (/root/asan_test/heap_ovf_test+0x40075d)0x603000000030 is located 0 bytes to the right of 32-byte region [0x603000000010,0x603000000030)allocated by thread T0 here:#0 0x7f3de9040ba8 in __interceptor_malloc (/lib64/libasan.so.5+0xefba8)#1 0x400827 in main (/root/asan_test/heap_ovf_test+0x400827)#2 0x7f3de8bb1872 in __libc_start_main (/lib64/libc.so.6+0x23872)SUMMARY: AddressSanitizer: heap-buffer-overflow (/lib64/libasan.so.5+0x40a1c)Shadow bytes around the buggy address:0x0c067fff7fb0: 00 00 00 00 00 00 00 00 00 00 00 00 00 00 00 000x0c067fff7fc0: 00 00 00 00 00 00 00 00 00 00 00 00 00 00 00 000x0c067fff7fd0: 00 00 00 00 00 00 00 00 00 00 00 00 00 00 00 000x0c067fff7fe0: 00 00 00 00 00 00 00 00 00 00 00 00 00 00 00 000x0c067fff7ff0: 00 00 00 00 00 00 00 00 00 00 00 00 00 00 00 00=>0x0c067fff8000: fa fa 00 00 00 00[fa]fa fa fa fa fa fa fa fa fa0x0c067fff8010: fa fa fa fa fa fa fa fa fa fa fa fa fa fa fa fa0x0c067fff8020: fa fa fa fa fa fa fa fa fa fa fa fa fa fa fa fa0x0c067fff8030: fa fa fa fa fa fa fa fa fa fa fa fa fa fa fa fa0x0c067fff8040: fa fa fa fa fa fa fa fa fa fa fa fa fa fa fa fa0x0c067fff8050: fa fa fa fa fa fa fa fa fa fa fa fa fa fa fa faShadow byte legend (one shadow byte represents 8 application bytes):Addressable: 00Partially addressable: 01 02 03 04 05 06 07Heap left redzone: faFreed heap region: fdStack left redzone: f1Stack mid redzone: f2Stack right redzone: f3Stack after return: f5Stack use after scope: f8Global redzone: f9Global init order: f6Poisoned by user: f7Container overflow: fcArray cookie: acIntra object redzone: bbASan internal: feLeft alloca redzone: caRight alloca redzone: cb==40602==ABORTING[root@yglocal asan_test]#
可以看到asan报错:==40602==ERROR: AddressSanitizer: heap-buffer-overflow on address 0x603000000030 at xxxx,下面也列出了发生heap-buffer-overflow时的调用链及heap buffer在哪里申请的。
[root@yglocal asan_test]# vi stack_ovf_test.c#include#includeint main(){char stack_buf[4] = {0};strcpy(stack_buf, "1234");return 0;}
编译并运行:
[root@yglocal asan_test]# ./stack_ovf_test===================================================================38634==ERROR: AddressSanitizer: stack-buffer-overflow on address 0x7ffcf3d8b8d4 at pc 0x7f8714bbaa1d bp 0x7ffcf3d8b8a0 sp 0x7ffcf3d8b048WRITE of size 5 at 0x7ffcf3d8b8d4 thread T0#0 0x7f8714bbaa1c (/lib64/libasan.so.5+0x40a1c)#1 0x400949 in main (/root/asan_test/stack_ovf_test+0x400949)#2 0x7f87147da872 in __libc_start_main (/lib64/libc.so.6+0x23872)#3 0x4007cd in _start (/root/asan_test/stack_ovf_test+0x4007cd)Address 0x7ffcf3d8b8d4 is located in stack of thread T0 at offset 36 in frame#0 0x400895 in main (/root/asan_test/stack_ovf_test+0x400895)This frame has 1 object(s):[32, 36) 'stack_buf' <== Memory access at offset 36 overflows this variableHINT: this may be a false positive if your program uses some custom stack unwind mechanism or swapcontext(longjmp and C++ exceptions *are* supported)SUMMARY: AddressSanitizer: stack-buffer-overflow (/lib64/libasan.so.5+0x40a1c)Shadow bytes around the buggy address:0x10001e7a96c0: 00 00 00 00 00 00 00 00 00 00 00 00 00 00 00 000x10001e7a96d0: 00 00 00 00 00 00 00 00 00 00 00 00 00 00 00 000x10001e7a96e0: 00 00 00 00 00 00 00 00 00 00 00 00 00 00 00 000x10001e7a96f0: 00 00 00 00 00 00 00 00 00 00 00 00 00 00 00 000x10001e7a9700: 00 00 00 00 00 00 00 00 00 00 00 00 00 00 00 00=>0x10001e7a9710: 00 00 00 00 00 00 f1 f1 f1 f1[04]f2 f2 f2 f3 f30x10001e7a9720: f3 f3 00 00 00 00 00 00 00 00 00 00 00 00 00 000x10001e7a9730: 00 00 00 00 00 00 00 00 00 00 00 00 00 00 00 000x10001e7a9740: 00 00 00 00 00 00 00 00 00 00 00 00 00 00 00 000x10001e7a9750: 00 00 00 00 00 00 00 00 00 00 00 00 00 00 00 000x10001e7a9760: 00 00 00 00 00 00 00 00 00 00 00 00 00 00 00 00......
[root@yglocal asan_test]# vi dangling_pointer_test.c#include#include#includeint main(){char *p = (char*)malloc(32*sizeof(char));free(p);int a = p[1];return 0;}
[root@yglocal asan_test]# gcc -fsanitize=address -fno-omit-frame-pointer -o dangling_pointer_test dangling_pointer_test.c[root@yglocal asan_test]# ./dangling_pointer_test===================================================================83532==ERROR: AddressSanitizer: heap-use-after-free on address 0x603000000011 at pc 0x0000004007c4 bp 0x7ffd7f562760 sp 0x7ffd7f562750READ of size 1 at 0x603000000011 thread T0#0 0x4007c3 in main (/root/asan_test/dangling_pointer_test+0x4007c3)#1 0x7f56196cd872 in __libc_start_main (/lib64/libc.so.6+0x23872)#2 0x4006ad in _start (/root/asan_test/dangling_pointer_test+0x4006ad)0x603000000011 is located 1 bytes inside of 32-byte region [0x603000000010,0x603000000030)freed by thread T0 here:#0 0x7f5619b5c7e0 in __interceptor_free (/lib64/libasan.so.5+0xef7e0)#1 0x400787 in main (/root/asan_test/dangling_pointer_test+0x400787)#2 0x7f56196cd872 in __libc_start_main (/lib64/libc.so.6+0x23872)previously allocated by thread T0 here:#0 0x7f5619b5cba8 in __interceptor_malloc (/lib64/libasan.so.5+0xefba8)#1 0x400777 in main (/root/asan_test/dangling_pointer_test+0x400777)#2 0x7f56196cd872 in __libc_start_main (/lib64/libc.so.6+0x23872)SUMMARY: AddressSanitizer: heap-use-after-free (/root/asan_test/dangling_pointer_test+0x4007c3) in mainShadow bytes around the buggy address:0x0c067fff7fb0: 00 00 00 00 00 00 00 00 00 00 00 00 00 00 00 000x0c067fff7fc0: 00 00 00 00 00 00 00 00 00 00 00 00 00 00 00 000x0c067fff7fd0: 00 00 00 00 00 00 00 00 00 00 00 00 00 00 00 000x0c067fff7fe0: 00 00 00 00 00 00 00 00 00 00 00 00 00 00 00 000x0c067fff7ff0: 00 00 00 00 00 00 00 00 00 00 00 00 00 00 00 00=>0x0c067fff8000: fa fa[fd]fd fd fd fa fa fa fa fa fa fa fa fa fa0x0c067fff8010: fa fa fa fa fa fa fa fa fa fa fa fa fa fa fa fa0x0c067fff8020: fa fa fa fa fa fa fa fa fa fa fa fa fa fa fa fa0x0c067fff8030: fa fa fa fa fa fa fa fa fa fa fa fa fa fa fa fa0x0c067fff8040: fa fa fa fa fa fa fa fa fa fa fa fa fa fa fa fa0x0c067fff8050: fa fa fa fa fa fa fa fa fa fa fa fa fa fa fa faShadow byte legend (one shadow byte represents 8 application bytes):......
[root@yglocal asan_test]# vi use-after-return.c#include#include#includeint *ptr;void get_pointer(){int local[10];ptr = &local[0];return;}int main(){get_pointer();printf("%d\n", *ptr);return 0;}
[root@yglocal asan_test]# gcc -fsanitize=address -fno-omit-frame-pointer -o use_after_return use-after-return.c[root@yglocal asan_test]# ASAN_OPTIONS=detect_stack_use_after_return=1 ./use_after_return===================================================================108419==ERROR: AddressSanitizer: stack-use-after-return on address 0x7fa2de200020 at pc 0x0000004009a2 bp 0x7ffccaef23c0 sp 0x7ffccaef23b0READ of size 4 at 0x7fa2de200020 thread T0#0 0x4009a1 in main (/root/asan_test/use_after_return+0x4009a1)#1 0x7fa2e264d872 in __libc_start_main (/lib64/libc.so.6+0x23872)#2 0x4007cd in _start (/root/asan_test/use_after_return+0x4007cd)Address 0x7fa2de200020 is located in stack of thread T0 at offset 32 in frame#0 0x400895 in get_pointer (/root/asan_test/use_after_return+0x400895)This frame has 1 object(s):[32, 72) 'local' <== Memory access at offset 32 is inside this variableHINT: this may be a false positive if your program uses some custom stack unwind mechanism or swapcontext(longjmp and C++ exceptions *are* supported)SUMMARY: AddressSanitizer: stack-use-after-return (/root/asan_test/use_after_return+0x4009a1) in mainShadow bytes around the buggy address:0x0ff4dbc37fb0: 00 00 00 00 00 00 00 00 00 00 00 00 00 00 00 000x0ff4dbc37fc0: 00 00 00 00 00 00 00 00 00 00 00 00 00 00 00 000x0ff4dbc37fd0: 00 00 00 00 00 00 00 00 00 00 00 00 00 00 00 000x0ff4dbc37fe0: 00 00 00 00 00 00 00 00 00 00 00 00 00 00 00 000x0ff4dbc37ff0: 00 00 00 00 00 00 00 00 00 00 00 00 00 00 00 00=>0x0ff4dbc38000: f5 f5 f5 f5[f5]f5 f5 f5 f5 f5 f5 f5 f5 f5 f5 f50x0ff4dbc38010: 00 00 00 00 00 00 00 00 00 00 00 00 00 00 00 000x0ff4dbc38020: 00 00 00 00 00 00 00 00 00 00 00 00 00 00 00 000x0ff4dbc38030: 00 00 00 00 00 00 00 00 00 00 00 00 00 00 00 000x0ff4dbc38040: 00 00 00 00 00 00 00 00 00 00 00 00 00 00 00 000x0ff4dbc38050: 00 00 00 00 00 00 00 00 00 00 00 00 00 00 00 00......
注:运行时,启用ASAN_OPTIONS=detect_stack_use_after_return=1标志,才能检测此种内存错误使用的情况。
测试代码:
[root@yglocal asan_test]int main(){int *p;{int num = 10;p = #}printf("%d/n", *p);return 0;}
编译并运行:
[root@yglocal asan_test]# ./use-after-scope===================================================================45490==ERROR: AddressSanitizer: stack-use-after-scope on address 0x7fffda668b50 at pc 0x0000004009ea bp 0x7fffda668b10 sp 0x7fffda668b00READ of size 4 at 0x7fffda668b50 thread T0#0 0x4009e9 in main (/root/asan_test/use-after-scope+0x4009e9)#1 0x7fc2194ca872 in __libc_start_main (/lib64/libc.so.6+0x23872)#2 0x40082d in _start (/root/asan_test/use-after-scope+0x40082d)Address 0x7fffda668b50 is located in stack of thread T0 at offset 32 in frame#0 0x4008f5 in main (/root/asan_test/use-after-scope+0x4008f5)This frame has 1 object(s):[32, 36) 'num' <== Memory access at offset 32 is inside this variableHINT: this may be a false positive if your program uses some custom stack unwind mechanism or swapcontext(longjmp and C++ exceptions *are* supported)SUMMARY: AddressSanitizer: stack-use-after-scope (/root/asan_test/use-after-scope+0x4009e9) in mainShadow bytes around the buggy address:0x10007b4c5110: 00 00 00 00 00 00 00 00 00 00 00 00 00 00 00 000x10007b4c5120: 00 00 00 00 00 00 00 00 00 00 00 00 00 00 00 000x10007b4c5130: 00 00 00 00 00 00 00 00 00 00 00 00 00 00 00 000x10007b4c5140: 00 00 00 00 00 00 00 00 00 00 00 00 00 00 00 000x10007b4c5150: 00 00 00 00 00 00 00 00 00 00 00 00 00 00 00 00=>0x10007b4c5160: 00 00 00 00 00 00 f1 f1 f1 f1[f8]f2 f2 f2 f3 f30x10007b4c5170: f3 f3 00 00 00 00 00 00 00 00 00 00 00 00 00 000x10007b4c5180: 00 00 00 00 00 00 00 00 00 00 00 00 00 00 00 000x10007b4c5190: 00 00 00 00 00 00 00 00 00 00 00 00 00 00 00 000x10007b4c51a0: 00 00 00 00 00 00 00 00 00 00 00 00 00 00 00 000x10007b4c51b0: 00 00 00 00 00 00 00 00 00 00 00 00 00 00 00 00......[root@yglocal asan_test]#
[root@yglocal asan_test]int main(){char *p = (char*)malloc(32*sizeof(char));free(p);free(p);return 0;}
运行并编译:
[root asan_test]# gcc -fsanitize=address -fno-omit-frame-pointer -o invalid_free_test invalid_free_test.c[root asan_test]# ./invalid_free_test===================================================================116778==ERROR: AddressSanitizer: attempting double-free on 0x603000000010 in thread T0:#0 0x7fab036ca7e0 in __interceptor_free (/lib64/libasan.so.5+0xef7e0)#1 0x400743 in main (/root/asan_test/invalid_free_test+0x400743)#2 0x7fab0323b872 in __libc_start_main (/lib64/libc.so.6+0x23872)#3 0x40065d in _start (/root/asan_test/invalid_free_test+0x40065d)0x603000000010 is located 0 bytes inside of 32-byte region [0x603000000010,0x603000000030)freed by thread T0 here:#0 0x7fab036ca7e0 in __interceptor_free (/lib64/libasan.so.5+0xef7e0)#1 0x400737 in main (/root/asan_test/invalid_free_test+0x400737)#2 0x7fab0323b872 in __libc_start_main (/lib64/libc.so.6+0x23872)previously allocated by thread T0 here:#0 0x7fab036caba8 in __interceptor_malloc (/lib64/libasan.so.5+0xefba8)#1 0x400727 in main (/root/asan_test/invalid_free_test+0x400727)#2 0x7fab0323b872 in __libc_start_main (/lib64/libc.so.6+0x23872)SUMMARY: AddressSanitizer: double-free (/lib64/libasan.so.5+0xef7e0) in __interceptor_free==116778==ABORTING
测试代码:
[root@yglocal asan_test]int main(){int *p;{int num = 10;p = #}printf("%d/n", *p);return 0;}
编译并运行:
[root@yglocal asan_test]# gcc -fsanitize=address -fno-omit-frame-pointer -o use-after-scope use-after-scope.c[root@yglocal asan_test]# ./use-after-scope===================================================================118523==ERROR: AddressSanitizer: stack-use-after-scope on address 0x7ffd35fafc60 at pc 0x0000004009ea bp 0x7ffd35fafc20 sp 0x7ffd35fafc10READ of size 4 at 0x7ffd35fafc60 thread T0#0 0x4009e9 in main (/root/asan_test/use-after-scope+0x4009e9)#1 0x7f6d2c4ce872 in __libc_start_main (/lib64/libc.so.6+0x23872)#2 0x40082d in _start (/root/asan_test/use-after-scope+0x40082d)Address 0x7ffd35fafc60 is located in stack of thread T0 at offset 32 in frame#0 0x4008f5 in main (/root/asan_test/use-after-scope+0x4008f5)This frame has 1 object(s):[32, 36) 'num' <== Memory access at offset 32 is inside this variableHINT: this may be a false positive if your program uses some custom stack unwind mechanism or swapcontext(longjmp and C++ exceptions *are* supported)SUMMARY: AddressSanitizer: stack-use-after-scope (/root/asan_test/use-after-scope+0x4009e9) in mainShadow bytes around the buggy address:0x100026bedf30: 00 00 00 00 00 00 00 00 00 00 00 00 00 00 00 000x100026bedf40: 00 00 00 00 00 00 00 00 00 00 00 00 00 00 00 000x100026bedf50: 00 00 00 00 00 00 00 00 00 00 00 00 00 00 00 000x100026bedf60: 00 00 00 00 00 00 00 00 00 00 00 00 00 00 00 000x100026bedf70: 00 00 00 00 00 00 00 00 00 00 00 00 00 00 00 00=>0x100026bedf80: 00 00 00 00 00 00 00 00 f1 f1 f1 f1[f8]f2 f2 f20x100026bedf90: f3 f3 f3 f3 00 00 00 00 00 00 00 00 00 00 00 000x100026bedfa0: 00 00 00 00 00 00 00 00 00 00 00 00 00 00 00 000x100026bedfb0: 00 00 00 00 00 00 00 00 00 00 00 00 00 00 00 000x100026bedfc0: 00 00 00 00 00 00 00 00 00 00 00 00 00 00 00 000x100026bedfd0: 00 00 00 00 00 00 00 00 00 00 00 00 00 00 00 00......
测试代码:
[root@yglocal asan_test]char* get_systeminfo(){char *p_system = (char*)malloc(38*sizeof(char));strcpy(p_system, "Linux version 4.18.0-147.el8.x86_64");return p_system;}int main(){printf("system info:%s", get_systeminfo());return 0;}
编译并运行:
[][]===================================================================122316==ERROR: LeakSanitizer: detected memory leaksDirect leak of 38 byte(s) in 1 object(s) allocated from:SUMMARY: AddressSanitizer: 38 byte(s) leaked in 1 allocation(s).
注:内存泄漏检测时,需带上ASAN_OPTIONS=detect_leaks=1参数启程序。
[root@yglocal asan_test]# ASAN_OPTIONS='stack_trace_format="[frame=%n, function=%f, location=%S]"' ./heap_ovf_test===================================================================31061==ERROR: AddressSanitizer: heap-use-after-free on address 0x603000000010 at pc 0x7f181e836796 bp 0x7ffd87d62c30 sp 0x7ffd87d623a8READ of size 2 at 0x603000000010 thread T0[frame=0, function=<null>, location=<null>][frame=1, function=__interceptor_vprintf, location=<null>][frame=2, function=__interceptor_printf, location=<null>][frame=3, function=main, location=<null>][frame=4, function=__libc_start_main, location=<null>][frame=5, function=_start, location=<null>]0x603000000010 is located 0 bytes inside of 32-byte region [0x603000000010,0x603000000030)freed by thread T0 here:[frame=0, function=__interceptor_free, location=<null>][frame=1, function=main, location=<null>][frame=2, function=__libc_start_main, location=<null>]previously allocated by thread T0 here:[frame=0, function=__interceptor_malloc, location=<null>][frame=1, function=main, location=<null>][frame=2, function=__libc_start_main, location=<null>]SUMMARY: AddressSanitizer: heap-use-after-free (/lib64/libasan.so.5+0x55795)Shadow bytes around the buggy address:0x0c067fff7fb0: 00 00 00 00 00 00 00 00 00 00 00 00 00 00 00 000x0c067fff7fc0: 00 00 00 00 00 00 00 00 00 00 00 00 00 00 00 000x0c067fff7fd0: 00 00 00 00 00 00 00 00 00 00 00 00 00 00 00 000x0c067fff7fe0: 00 00 00 00 00 00 00 00 00 00 00 00 00 00 00 000x0c067fff7ff0: 00 00 00 00 00 00 00 00 00 00 00 00 00 00 00 00=>0x0c067fff8000: fa fa[fd]fd fd fd fa fa fa fa fa fa fa fa fa fa0x0c067fff8010: fa fa fa fa fa fa fa fa fa fa fa fa fa fa fa fa0x0c067fff8020: fa fa fa fa fa fa fa fa fa fa fa fa fa fa fa fa0x0c067fff8030: fa fa fa fa fa fa fa fa fa fa fa fa fa fa fa fa0x0c067fff8040: fa fa fa fa fa fa fa fa fa fa fa fa fa fa fa fa0x0c067fff8050: fa fa fa fa fa fa fa fa fa fa fa fa fa fa fa faShadow byte legend (one shadow byte represents 8 application bytes):Addressable: 00Partially addressable: 01 02 03 04 05 06 07Heap left redzone: faFreed heap region: fdStack left redzone: f1Stack mid redzone: f2Stack right redzone: f3Stack after return: f5Stack use after scope: f8Global redzone: f9Global init order: f6Poisoned by user: f7Container overflow: fcArray cookie: acIntra object redzone: bbASan internal: feLeft alloca redzone: caRight alloca redzone: cb==31061==ABORTING
输出的调用链中信息更精确,可以对应到代码文件的具体某一行:
[root@yglocal asan_test]# gcc -fsanitize=address -fno-omit-frame-pointer -g -o heap_ovf_test heap_ovf_test.c[root@yglocal asan_test]# ./heap_ovf_test 2>&1 | ./asan_symbolize.py===================================================================66336==ERROR: AddressSanitizer: heap-buffer-overflow on address 0x603000000030 at pc 0x7f0e8b19ea1d bp 0x7ffc0764d8a0 sp 0x7ffc0764d048WRITE of size 8 at 0x603000000030 thread T0#0 0x7f0e8b19ea1c in __interceptor_strpbrk ??:?#1 0x400845 in main /root/asan_test/heap_ovf_test.c:9#1 0x7f0e8adbe872 in __libc_start_main ??:?#2 0x40075d in _start ??:?0x603000000030 is located 0 bytes to the right of 32-byte region [0x603000000010,0x603000000030)allocated by thread T0 here:#0 0x7f0e8b24dba8 in malloc ??:?#1 0x400827 in main /root/asan_test/heap_ovf_test.c:8#1 0x7f0e8adbe872 in __libc_start_main ??:?SUMMARY: AddressSanitizer: heap-buffer-overflow (/lib64/libasan.so.5+0x40a1c)Shadow bytes around the buggy address:0x0c067fff7fb0: 00 00 00 00 00 00 00 00 00 00 00 00 00 00 00 000x0c067fff7fc0: 00 00 00 00 00 00 00 00 00 00 00 00 00 00 00 000x0c067fff7fd0: 00 00 00 00 00 00 00 00 00 00 00 00 00 00 00 000x0c067fff7fe0: 00 00 00 00 00 00 00 00 00 00 00 00 00 00 00 000x0c067fff7ff0: 00 00 00 00 00 00 00 00 00 00 00 00 00 00 00 00=>0x0c067fff8000: fa fa 00 00 00 00[fa]fa fa fa fa fa fa fa fa fa0x0c067fff8010: fa fa fa fa fa fa fa fa fa fa fa fa fa fa fa fa0x0c067fff8020: fa fa fa fa fa fa fa fa fa fa fa fa fa fa fa fa0x0c067fff8030: fa fa fa fa fa fa fa fa fa fa fa fa fa fa fa fa0x0c067fff8040: fa fa fa fa fa fa fa fa fa fa fa fa fa fa fa fa0x0c067fff8050: fa fa fa fa fa fa fa fa fa fa fa fa fa fa fa faShadow byte legend (one shadow byte represents 8 application bytes):Addressable: 00Partially addressable: 01 02 03 04 05 06 07Heap left redzone: faFreed heap region: fdStack left redzone: f1Stack mid redzone: f2Stack right redzone: f3Stack after return: f5Stack use after scope: f8Global redzone: f9Global init order: f6Poisoned by user: f7Container overflow: fcArray cookie: acIntra object redzone: bbASan internal: feLeft alloca redzone: caRight alloca redzone: cb==66336==ABORTING
更详细的使用可以查看参考链接相关页面。
参考链接:https://github.com/google/sanitizers/wiki/AddressSanitize
‧‧‧‧‧‧‧‧‧‧‧‧‧‧‧‧ END ‧‧‧‧‧‧‧‧‧‧‧‧‧‧‧‧
关注我的微信公众号,回复“加群”按规则加入技术交流群。
点击“阅读原文”查看更多分享,欢迎点分享、收藏、点赞、在看。
评论