点击左上方蓝字关注我们

1 介绍
焊接缺陷可以定义为焊缝表面出现的不规则、不连续性、缺陷或不一致性。焊接接头的缺陷可能导致零件和组件的报废、昂贵的维修费用、工作条件下性能的显著降低,在极端情况下,还可能导致导致财产和生命损失的灾难性故障。
此外,由于焊接工艺本身的缺陷和金属本身的特性,在焊接过程中总会存在一定的缺陷。评估焊接质量是很重要的,因为由于固有的冶金几何缺陷、机械性能的不均一性和残余应力的存在,焊接接头经常是裂纹萌生的位置。
在实践中,几乎不可能得到完美的焊接,而且在大多数情况下,也没有必要提供所需的足够的服务功能。然而,及早发现和隔离总是比发生事故更可取。
利用我们的算法,我们可以很容易地检测出焊接故障的图像,并准确地衡量每一个故障的严重程度。这将进一步帮助更快的图像识别和避免不良情况的出现。
结果表明,采用卷积神经网络算法和U-Net结构,可以大大提高处理效率。结果在工作结束时,准确率达到98.3%。
2 预备知识
对机器学习有基本了解 卷积神经网络的基本思想 理解卷积,最大池化和上采样操作 了解U-Net的架构理念 对残差块中skip连接有基本了解(可选) 使用Python、TensorFlow和Keras库操作ConvNets的知识(可选)
3 图像分割
分割是将图像分割成不同的区域,这些区域包含具有相似属性的像素。为了对图像分析和解释有意义和有用,区域应该与描绘的物体或感兴趣的特征有强烈的关联。
图像分析的成功与否取决于分割的可靠性,但图像的精确分割通常是一个非常具有挑战性的问题。
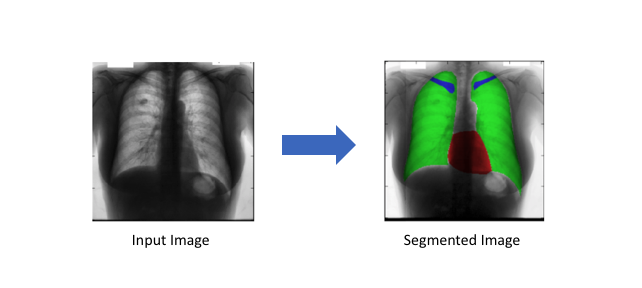
分割后的胸部x光片,心脏(红色)、肺(绿色)和锁骨(蓝色)
4 图像矩
图像矩是图像像素强度的某一特定加权平均值。图像矩用于描述分割后的目标。
通过图像矩发现的图像的简单属性包括:
面积(或总强度) 重心 关于方向的信息
5 理解数据
dataset包含两个目录。原始图像存储在‘images’目录中,分割后的图像存储在‘labels’目录中。
让我们将数据可视化:

来自‘image’的原始图像

来自‘labels’的二值图像
这些来自“labels”目录的图像是二进制图像或ground truth标签。这是我们的模型必须对给定的原始图像做出的预测。在二进制图像中,像素要么有一个“high”值,要么有一个“low”值。白色区域或“high”值表示缺陷区域,黑色区域或“low”值表示没有缺陷。
6 使用的方法
我们在这个问题上使用的架构是U-Net。我们将通过三个步骤来检测故障并测量这些焊接图像的严重程度:
图像分割 使用颜色表示严重程度 使用图像矩度量严重程度
训练模型
下面是我们用于模型的U-Net架构:
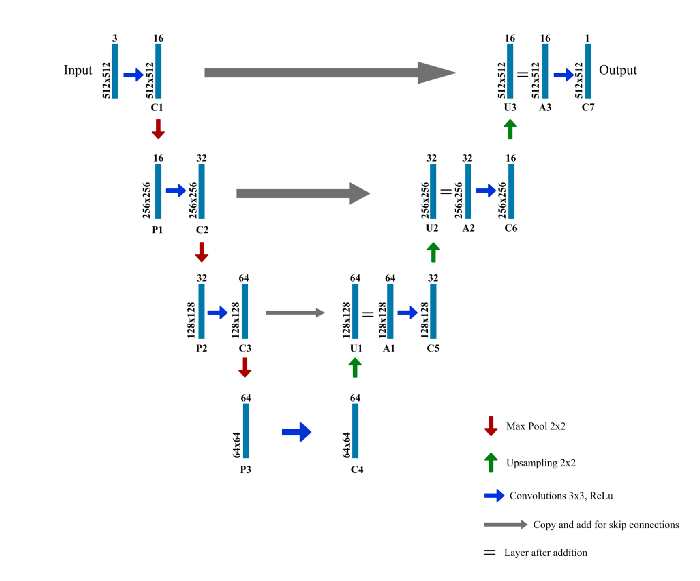
使用的U-Net结构
要注意的点:
每个蓝框对应一个多通道特征图
通道的数量在盒子的顶部表示
(x,y)维度显示在盒子的左下边缘
箭头表示不同的操作
层的名称在层的下面
C1 C2…C7是卷积操作后的输出层
P1, P2, P3是最大池化操作的输出层
U1, U2, U3是上采样操作的输出层
A1, A2, A3是跳跃连接
左侧是收缩路径,应用常规卷积和最大池操作
图像的尺寸逐渐减小,而深度逐渐增加
右边是展开路径,在这里应用(上采样)转置卷积和常规卷积操作
在扩展路径中,图像的尺寸逐渐增大,深度逐渐减小
为了得到更精确的位置,在扩展路径的每一步中,我们使用跳跃连接,将转置卷积层的输出与来自编码器的相同级别的特征图连接在一起:A1 = U1 + C3 A2 = U2 + C2 A3 = U3 + C1
在每次连接之后,我们再次应用常规卷积,以便模型能够学习组装出更精确的输出。
import numpy as np
import cv2
import os
import random
import tensorflow as tf

h,w = 512,512

def create_model():

    inputs = tf.keras.layers.Input(shape=(h,w,3))

    conv1 = tf.keras.layers.Conv2D(16,(3,3),activation='relu',padding='same')(inputs)
    pool1 = tf.keras.layers.MaxPool2D()(conv1)

    conv2 = tf.keras.layers.Conv2D(32,(3,3),activation='relu',padding='same')(pool1)
    pool2 = tf.keras.layers.MaxPool2D()(conv2)

    conv3 = tf.keras.layers.Conv2D(64,(3,3),activation='relu',padding='same')(pool2)
    pool3 = tf.keras.layers.MaxPool2D()(conv3)

    conv4 = tf.keras.layers.Conv2D(64,(3,3),activation='relu',padding='same')(pool3)

    upsm5 = tf.keras.layers.UpSampling2D()(conv4)
    upad5 = tf.keras.layers.Add()([conv3,upsm5])
    conv5 = tf.keras.layers.Conv2D(32,(3,3),activation='relu',padding='same')(upad5)

    upsm6 = tf.keras.layers.UpSampling2D()(conv5)
    upad6 = tf.keras.layers.Add()([conv2,upsm6])
    conv6 = tf.keras.layers.Conv2D(16,(3,3),activation='relu',padding='same')(upad6)

    upsm7 = tf.keras.layers.UpSampling2D()(conv6)
    upad7 = tf.keras.layers.Add()([conv1,upsm7])
    conv7 = tf.keras.layers.Conv2D(1,(3,3),activation='relu',padding='same')(upad7)

    model = tf.keras.models.Model(inputs=inputs, outputs=conv7)

    return model

images = []
labels = []

files = os.listdir('./dataset/images/')
random.shuffle(files)

for f in files:
    img = cv2.imread('./dataset/images/' + f)
    parts = f.split('_')
    label_name = './dataset/labels/' + 'W0002_' + parts[1]
    label = cv2.imread(label_name,2)

    img = cv2.resize(img,(w,h))
    label = cv2.resize(label,(w,h))

    images.append(img)
    labels.append(label)

images = np.array(images)
labels = np.array(labels)
labels = np.reshape(labels,
    (labels.shape[0],labels.shape[1],labels.shape[2],1))

print(images.shape)
print(labels.shape)

images = images/255
labels = labels/255

model = tf.keras.models.load_model('my_model')

#model = create_model()  # uncomment this to create a new model
print(model.summary())

model.compile(optimizer='adam', loss='binary_crossentropy',metrics=['accuracy'])
model.fit(images,labels,epochs=100,batch_size=10)
model.evaluate(images,labels)

model.save('my_model')
模型采用Adam优化器进行编译,由于只有缺陷和无缺陷两类,我们使用二元交叉熵损失函数。
我们使用批大小为10的100 epoch(模型在所有输入上运行的次数)。
请注意,调整这些超参数有很大的进一步提高模型性能的空间。
测试模型
由于模型的输入尺寸为512x512x3,我们将输入尺寸调整为这个尺寸。接下来,我们将图像归一化,将其除以255,这样计算速度更快。
该图像被输入到模型中,用于预测二进制输出。为了放大像素的强度,二进制输出被乘以1000。
然后将图像转换为16位整数,便于图像操作。然后用算法检测缺陷,通过颜色分级和根据缺陷的严重程度给有缺陷的像素分配权重,直观地标记出缺陷的严重程度。然后在此图像上考虑加权像素计算图像矩。
最后将图像转换回8位整数,并显示输出图像的颜色等级和严重性值。
import numpy as np
import cv2
from google.colab.patches import cv2_imshow
import os
import random
import tensorflow as tf


h,w = 512,512
num_cases = 10

images = []
labels = []

files = os.listdir('./dataset/images/')
random.shuffle(files)

model = tf.keras.models.load_model('my_model')

lowSevere = 1
midSevere = 2
highSevere = 4

for f in files[0:num_cases]:
    test_img = cv2.imread('./dataset/images/' + f)
    resized_img = cv2.resize(test_img,(w,h))
    resized_img = resized_img/255
    cropped_img = np.reshape(resized_img,
          (1,resized_img.shape[0],resized_img.shape[1],resized_img.shape[2]))

    test_out = model.predict(cropped_img)

    test_out = test_out[0,:,:,0]*1000
    test_out = np.clip(test_out,0,255)

    resized_test_out = cv2.resize(test_out,(test_img.shape[1],test_img.shape[0]))
    resized_test_out = resized_test_out.astype(np.uint16)

    test_img = test_img.astype(np.uint16)

    grey = cv2.cvtColor(test_img, cv2.COLOR_BGR2GRAY)

    for i in range(test_img.shape[0]):
     for j in range(test_img.shape[1]):
          if(grey[i,j]>150 & resized_test_out[i,j]>40):
            test_img[i,j,1]=test_img[i,j,1] + resized_test_out[i,j]
            resized_test_out[i,j] = lowSevere
          elif(grey[i,j]<100 & resized_test_out[i,j]>40):
            test_img[i,j,2]=test_img[i,j,2] + resized_test_out[i,j]
            resized_test_out[i,j] = highSevere
          elif(resized_test_out[i,j]>40):
            test_img[i,j,0]=test_img[i,j,0] + resized_test_out[i,j]
            resized_test_out[i,j] = midSevere
          else:
            resized_test_out[i,j] = 0

    M = cv2.moments(resized_test_out)
    maxMomentArea = resized_test_out.shape[1]*resized_test_out.shape[0]*highSevere
    print("0th Moment = " , (M["m00"]*100/maxMomentArea), "%")

    test_img = np.clip(test_img,0,255)

    test_img = test_img.astype(np.uint8)

    cv2_imshow(test_img)

    cv2.waitKey(0)
7 结果
我们用于检测严重程度的视觉度量是颜色。
在图像中,颜色:
绿色表示有严重缺陷的区域。 蓝色代表缺陷较严重的区域。 红色区域表示最严重的缺陷。
0阶矩作为一个百分比显示在输出图像上作为一个经验的严重程度度量。
下面是三个随机样本,分别显示了我们模型生成的原始输入、ground truth和输出。
样本1::

原始图像

二值图像(Ground Truth)

带有严重程度的预测输出
样本2:

原始图像

二值图像(Ground Truth)

带有严重程度的预测输出
样本3:

原始图像

二值图像(Ground Truth)

END
 整理不易,点赞鼓励一下吧↓
