K8s 的节点问题检测器原理解析
共 55159字,需浏览 111分钟
· 2021-08-25

NPD 入门
简介
节点问题检测器(Node Problem Detector) 是一个守护程序,用于监视和报告节点的健康状况(包括内核死锁、OOM、系统线程数压力、系统文件描述符压力等指标)。你可以将节点问题探测器以 DaemonSet 或独立守护程序运行。节点问题检测器从各种守护进程收集节点问题,并以 NodeCondition[1] 和 Event[2] 的形式报告给 API Server。您可以通过检测相应的指标,提前预知节点的资源压力,可以在节点开始驱逐 Pod 之前手动释放或扩容节点资源压力,防止 Kubenetes 进行资源回收或节点不可用可能带来的损失。
Git 仓库地址:https://github.com/kubernetes/node-problem-detector[3]
Kubernetes 目前问题
基础架构守护程序问题:ntp 服务关闭; 硬件问题:CPU,内存或磁盘损坏; 内核问题:内核死锁,文件系统损坏; 容器运行时问题:运行时守护程序无响应 ...
当 kubernetes 中节点发生上述问题,在整个集群中,k8s 服务组件并不会感知以上问题,就会导致 pod 仍会调度至问题节点。
为了解决这个问题,我们引入了这个新的守护进程 node-problem-detector,从各个守护进程收集节点问题,并使它们对上游层可见。一旦上游层面发现了这些问题,我们就可以讨论补救措施。
NPD 使用
构建
NPD 使用 Go modules 管理依赖,因此构建它需要 Go SDK 1.11+:
cd $GOPATH/src/k8s.io
go get k8s.io/node-problem-detector
cd node-problem-detector

export GO111MODULE=on
go mod vendor

# 设置构建标记
export BUILD_TAGS="disable_custom_plugin_monitor disable_system_stats_monitor"

# 在Ubuntu 14.04上需要安装
sudo apt install libsystemd-journal-dev
make all
安装
# add repo
helm repo add feisky https://feisky.xyz/kubernetes-charts
helm update

# install packages
helm install feisky/node-problem-detector --namespace kube-system --name npd
启动参数
--version: 在控制台打印 NPD 的版本号. --hostname-override: 供 NPD 使用的自定义的节点名称,NPD 会优先获取该参数设置的节点名称,其次是从 NODE_NAME 环境变量中获取,最后从 os.Hostname() 方法获取。
system-log-monitor 相关参数
--config.system-log-monitor: system log monitor 配置文件路径,多个文件用逗号分隔, 如 config/kernel-monitor.json[4]. NPD 会为每一个配置文件生成单独的 log monitor。你可以使用不同的 log monitors 来监控不同的系统日志。
system-stats-monitor 相关参数
--config.system-stats-monitor: system status monitor 配置文件路径,多个文件用逗号分隔, 如 config/system-stats-monitor.json[5]. NPD 会为每一个配置文件生成单独的 status monitor。你可以使用不同的 status monitors 来监控系统的不同状态。
custom-plugin-monitor 相关参数
--config.custom-plugin-monitor: 用户自定义插件配置文件路径,多个文件用逗号分隔, 如 config/custom-plugin-monitor.json[6]. NPD 会为每一个配置文件生成单独的自定义插件监视器。你可以使用不同的自定义插件监视器来监控不同的系统问题。
K8s exporter 相关参数
--enable-k8s-exporter: 是否开启上报信息到 API Server,默认为 true.
--apiserver-override: 一个 URI 参数,用于自定义 node-problem-detector 连接 apiserver 的地址。如果--enable-k8s-exporter 为 false,则忽略此内容。格式与 Heapster 的源标志相同。例如,要在没有身份验证的情况下运行,请使用以下配置:http://APISERVER_IP:APISERVER_PORT?inClusterConfig=false[7]
请参阅 heapster[8] 文档以获取可用选项的完整列表。
--address: 绑定 NPD 服务器的地址。
--port: NPD 服务端口,如果为 0,表示禁用 NPD 服务。
Prometheus exporter 相关参数
--prometheus-address: 绑定 Prometheus 抓取端点的地址,默认为 127.0.0.1。 --prometheus-port: 绑定 Prometheus 抓取端点的端口,默认为 20257。使用 0 禁用。
Stackdriver exporter 相关参数
--exporter.stackdriver: Stackdriver exporter 程序配置文件的路径,例如 config/exporter/stackdriver-exporter.json[9],默认为空字符串。设置为空字符串以禁用。
过期参数
--system-log-monitors: system log monitor 配置文件路径,多个文件用逗号分隔。该选项已过期, 被 --config.system-log-monitor 取代, 即将被移除. 如果在启动 NPD 时同时设置了 --system-log-monitors 和 --config.system-log-monitor,会引发 panic。 --custom-plugin-monitors: 用户自定义插件配置文件路径,多个文件用逗号分隔。该选项已过期, 被 --config.custom-plugin-monitor 取代, 即将被移除. 如果在启动 NPD 时同时设置了 --custom-plugin-monitors 和 --config.custom-plugin-monitor,会引发 panic。
覆盖配置文件
构建节点问题检测器的 docker 镜像时,会嵌入 默认配置[10]。
不过,你可以像下面这样使用 ConfigMap[11] 将其覆盖:
1、更改 config/ 中的配置文件
2、创建 ConfigMap node-strick-detector-config:
kubectl create configmap node-problem-detector-config --from-file=config/
3、更改 node-problem-detector.yaml 以使用 ConfigMap:
apiVersion: apps/v1
kind: DaemonSet
metadata:
  name: node-problem-detector-v0.1
  namespace: kube-system
  labels:
    k8s-app: node-problem-detector
    version: v0.1
    kubernetes.io/cluster-service: "true"
spec:
  selector:
    matchLabels:
      k8s-app: node-problem-detector
      version: v0.1
      kubernetes.io/cluster-service: "true"
  template:
    metadata:
      labels:
        k8s-app: node-problem-detector
        version: v0.1
        kubernetes.io/cluster-service: "true"
    spec:
      hostNetwork: true
      containers:
      - name: node-problem-detector
        image: k8s.gcr.io/node-problem-detector:v0.1
        securityContext:
          privileged: true
        resources:
          limits:
            cpu: "200m"
            memory: "100Mi"
          requests:
            cpu: "20m"
            memory: "20Mi"
        volumeMounts:
        - name: log
          mountPath: /log
          readOnly: true
        - name: config # Overwrite the config/ directory with ConfigMap volume
          mountPath: /config
          readOnly: true
      volumes:
      - name: log
        hostPath:
          path: /var/log/
      - name: config # Define ConfigMap volume
        configMap:
          name: node-problem-detector-config
4、使用新的配置文件重新创建节点问题检测器:
说明: 此方法仅适用于通过 kubectl 启动的节点问题检测器。
如果节点问题检测器作为集群插件运行,则不支持覆盖配置。插件管理器不支持 ConfigMap。
如何验证 NPD 捕获信息
通常这些错误是比较难真实测试,只能通过发送消息到 journal 来模拟。
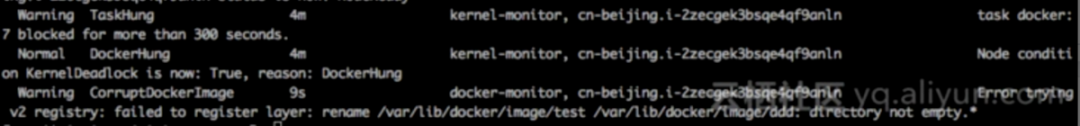
发送一个 kernel deadlock 类型的 condition:在对应的 node 节点上执行以下操作
echo "task docker:7 blocked for more than 300 seconds." |systemd-cat -t kernel
然后通过 k8s 控制台,你可以看到对应的信息:
发送一个 event
echo "Error trying v2 registry: failed to register layer: rename /var/lib/docker/image/test /var/lib/docker/image/ddd: directory not empty.*" |systemd-cat -t docker
然后通过以下命令来对应的 event
kubectl describe node/xxxx
实现原理
核心组件
Problem Daemon(Monitor)
Problem Daemon 是监控任务子守护进程,NPD 会为每一个 Problem Daemon 配置文件创建一个守护进程,这些配置文件通过 --config.custom-plugin-monitor、--config.system-log-monitor、--config.system-stats-monitor 参数指定。每个 Problem Daemon 监控一个特定类型的节点故障,并报告给 NPD。目前 Problem Daemon 以 Goroutine 的形式运行在 NPD 中,未来会支持在独立进程(容器)中运行并编排为一个 Pod。在编译期间,可以通过相应的标记禁用每一类 Problem Daemon。
custom-plugin-monitor:用户自定义的 Problem Daemon system-log-monitor:系统日志监控 system-stats-monitor:系统状态监控
ProblemDaemonHandler
ProblemDaemonHandler 定义了 Problem Daemon 的初始化方法
type ProblemDaemonHandler struct {
    // 初始化 Problem Daemon实例,如果初始化过程中出错,则抛出 panic
    CreateProblemDaemonOrDie func(string) Monitor
  // 说明了从命令行参数配置 Problem Daemon 的方式
    CmdOptionDescription string
}
在 NPD 启动时,init()方法中完成了 ProblemDaemonHandler 的注册:
var (
    // 在 NPD 启动过程中,通过 init() 方法注册
    handlers = make(map[types.ProblemDaemonType]types.ProblemDaemonHandler)
)

// 注册 problem daemon 工厂方法,将会用于创建 problem daemon
func Register(problemDaemonType types.ProblemDaemonType, handler types.ProblemDaemonHandler) {
    handlers[problemDaemonType] = handler
}
Exporter
Exporter 用于上报节点健康信息到某种控制面。在 NPD 启动时,会根据需求初始化并启动各种 Exporter。Exporter 分为三类:
K8s Exporter:会将节点健康信息上报到 API Server。 Prometheus Exporter:负责上报节点指标信息到 Prometheus。 Plugable Exporters:可插拔的 Exporter(如 Stackdriver Exporter),我们也可以自定义 Exporter,并在 init() 方法中注册,这样在 NPD 启动时就会自动初始化并启动。
详见:https://km.sankuai.com/page/1072724542[12]
ExporterHandler
ExporterHandler 和 ProblemDaemonHandler 功能类似,其定义了 Exporter 的初始化方法。也是在 NPD 启动时,init()方法中完成了 ExporterHandler 的注册
type ExporterHandler struct {
    // CreateExporterOrDie initializes an exporter, panic if error occurs.
    CreateExporterOrDie func(CommandLineOptions) Exporter
    // CmdOptionDescription explains how to configure the exporter from command line arguments.
    Options CommandLineOptions
}
Condition Manager
K8s Exporter 获取到的异常 Condition 信息会上报给 Condition Manager, Condition Manager 每秒检查 Condition 的变化,并同步到 API Server 的 Node 对象中。
Problem Client
Problem Client 负责与 API Server 交互,并将巡检过程中生成的 Events 和 Conditions 上报给 API Server。
type Client interface {
    // 从 API Server 获取当前节点所有指定类型的 Conditions
    GetConditions(conditionTypes []v1.NodeConditionType) ([]*v1.NodeCondition, error)
    // 调用 API Server 接口更新当前节点的 Condition 列表
    SetConditions(conditions []v1.NodeCondition) error
    // 上报 Event 信息到 API Server
    Eventf(eventType string, source, reason, messageFmt string, args ...interface{})
    // 从 API Server 获取当前 node-problem-detector 实例所在的节点信息
    GetNode() (*v1.Node, error)
}
Problem Detector
Problem Detector 是 NPD 的核心对象,它负责启动所有的 Problem Daemon[13](也可以叫做 Monitor),并利用 channel 收集 Problem Daemon[14] 中发现的异常信息,然后将异常信息提交给 Exporter[15],Exporter[16] 负责将这些异常信息上报到指定的控制面(如 API Server、Prometheus、Stackdriver[17]等)。
详见:https://km.sankuai.com/page/1074277220[18]
Status
Status 是 Problem Daemon 向 Exporter 上报的异常信息对象。
type Status struct {
    // problem daemon 的名称
    Source string `json:"source"`
    // 临时的节点问题 —— 事件对象,如果此Status用于Condition更新则此字段可以为空
  // 从老到新排列在数组中
    Events []Event `json:"events"`
    // 永久的节点问题 —— NodeCondition。PD必须总是在此字段报告最新的Condition
    Conditions []Condition `json:"conditions"`
}
Tomb
用于从外部控制协程的生命周期, 它的逻辑很简单,准备结束生命周期时:
外部协作者发起一个通知 协作线程接收到通知,进行清理 清理完成后,协程反向通知外部协作者 外部协作者退出阻塞
启动过程
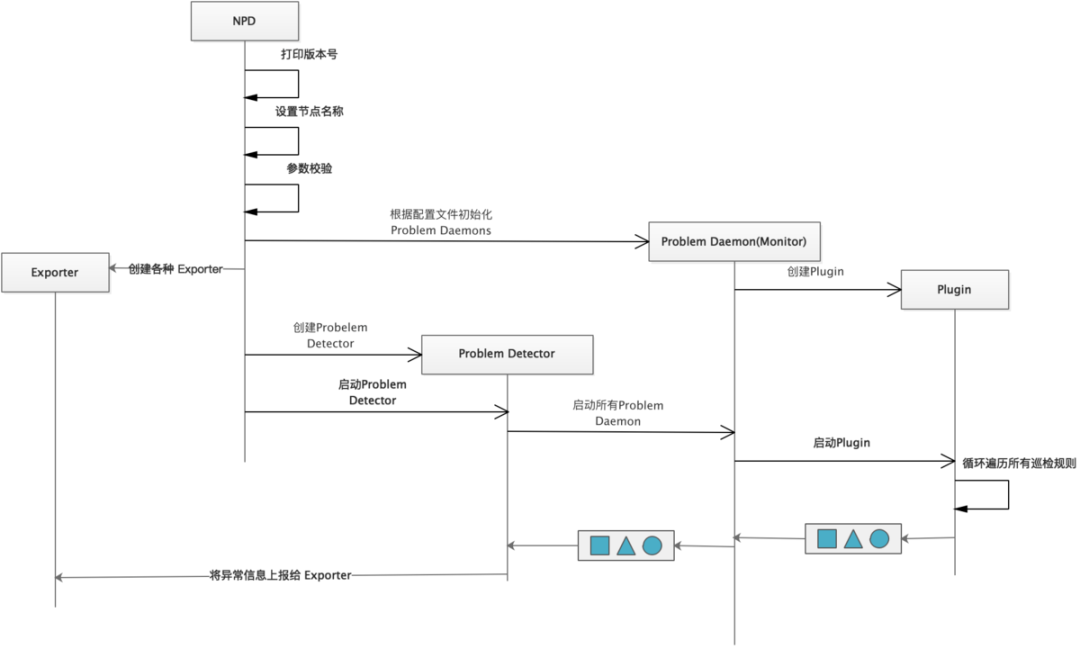
NPD 启动过程完成的工作有:
打印 NPD 版本号 设置节点名称,优先使用命令行中设置的节点名称,其次是环境变量 NODE_NAME 中的节点名称,最次是 os.Hostname() 校验命令行参数的合法性 初始化 problem daemons 初始化默认 Exporters(包含 K8s Exporter、Prometheus Exporter)和可插拔 Exporters(如 Stackdriver Exporter) 使用 problem daemons 和 Exporters 构建 Problem Detector,并启动
检测流程

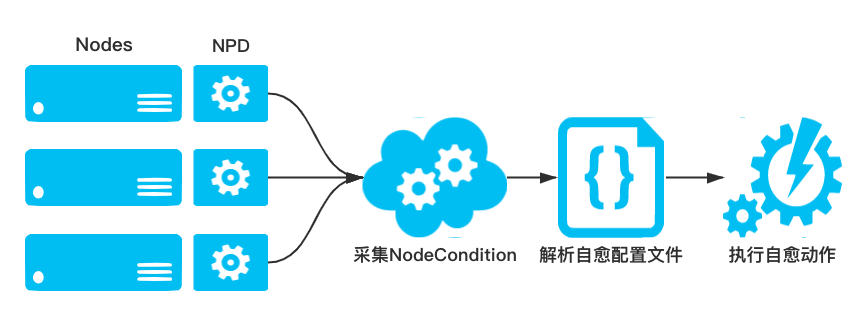
节点自愈
采集节点的健康状态是为了能够在业务 Pod 不可用之前提前发现节点异常,从而运维或开发人员可以对 Docker、Kubelet 或节点进行修复。在 NPDPlus 中,为了减轻运维人员的负担,提供了根据采集到的节点状态从而进行不同自愈动作的能力。集群管理员可以根据节点不同的状态配置相应的自愈能力,如重启 Docker、重启 Kubelet 或重启 CVM 节点等。同时为了防止集群中的节点雪崩,在执行自愈动作之前做了严格的限流,防止节点大规模重启。同时为了防止集群中的节点雪崩,在执行自愈动作之前做了严格的限流。具体策略为:
在同一时刻只允许集群中的一个节点进行自愈行为,并且两个自愈行为之间至少间隔 1 分钟
当有新节点添加到集群中时,会给节点 2 分钟的容忍时间,防止由于节点刚刚添加到集群的不稳定性导致错误自愈
custom-plugin-monitor
此 Problem Daemon 为 NPD 提供了一种插件化机制,允许基于任何语言来编写监控脚本,只需要这些脚本遵循 NPD 关于退出码和标准输出的规范。通过调用用户配置的脚本来检测各种节点问题
脚本退出码:
0:对于 Evnet 来说表示 Normal,对于 NodeCondition 表示 False 1:对于 Evnet 来说表示 Warning,对于 NodeCondition 表示 True
脚本输出应该小于 80 字节,避免给 Etcd 的存储造成压力
使用标记禁用:disable_custom_plugin_monitor
示例
{
  "plugin": "custom",  // 插件类型
  "pluginConfig": { // 插件配置
    "invoke_interval": "10s", // 执行时间间隔
    "timeout": "3m", // 健康检查超时时间
    "max_output_length": 80,
    "concurrency": 1 // 并行度
  },
  "source": "health-checker", // 事件源
  "metricsReporting": true,  // 是否上报指标信息
  "conditions": [ // 发现异常后在 Node 中设置的 Condition 信息
    {
      "type": "KubeletUnhealthy",
      "reason": "KubeletIsHealthy",
      "message": "kubelet on the node is functioning properly"
    }
  ],
  "rules": [ // 巡检规则
    {
      "type": "permanent",
      "condition": "KubeletUnhealthy",
      "reason": "KubeletUnhealthy",
      "path": "/home/kubernetes/bin/health-checker", // 二进制文件路径
      "args": [ // 二进制文件启动参数
        "--component=kubelet",
        "--enable-repair=true",// 是否启用自愈,自愈会尝试重启组件
        "--cooldown-time=1m", // 冷却时间,组件启动后的一段时间为冷却时间,冷却时间能如果发现异常,不会尝试自愈
        "--loopback-time=0",// 要回溯的 journal 日志的时间,如果为0,则从组件启动时间开始回溯
        "--health-check-timeout=10s" // 健康检查超时时间
      ],
      "timeout": "3m" // 巡检超时时间
    }
  ]
}
plugin
plugin 是 NPD 或用户自定义的一些异常检查程序,可以用任意语言编写。custom-plugin-monitor 在执行过程中会执行这些异常检测程序,并根据返回结果来判断是否存在异常。NPD 提供了三个 plugin,分别是:
health-check:检查 kubelet、docker、kube-proxy、cri 等进程是否健康。 log-counter:依赖的插件是 journald,其作用是统计指定的 journal 日志中近一段时间满足正则匹配的历史日志条数。 network_problem.sh:检查 conntrack table[19] 的使用率是否超过 90%。
health-checker
命令行参数
| 参数名称 | 参数说明 | 默认值 |
|---|---|---|
| systemd-service | 与 --service 相同,已被 --service 取代 | |
| service | The underlying service responsible for the component. Set to the corresponding component for docker and kubelet, containerd for cri. | |
| loopback-time | The duration to loop back, if it is 0, health-check will check from start time. | 0min |
| log-pattern | The log pattern to look for in service journald logs. The format for flag value | |
| health-check-timeout | The time to wait before marking the component as unhealthy. | 10s |
| enable-repair | Flag to enable/disable repair attempt for the component. | true |
| crictl-path | The path to the crictl binary. This is used to check health of cri component. | Linux:/usr/bin/crictl Windows:C:/etc/kubernetes/node/bin/crictl.exe |
| cri-socket-path | The path to the cri socket. Used with crictl to specify the socket path. | Linux:unix:///var/run/containerd/containerd.sock Windows:npipe:////./pipe/containerd-containerd |
| cooldown-time | The duration to wait for the service to be up before attempting repair. | 2min |
| component | The component to check health for. Supports kubelet, docker, kube-proxy, and cri. |
结构定义
type healthChecker struct {
    component       string // 要进行健康检查的组件名称,支持 kubelet、docker、kube-proxy 和 cri
    service         string // 组件的服务名称,需要通过 service 读取 journal 日志,并检查日志是否存在异常
    enableRepair    bool // 是否启动自动修复,如果启动自动修复,当发现异常时会调用 repairFunc 尝试自动修复
    healthCheckFunc func() (bool, error) // 组件健康检查方法
    repairFunc         func() // 组件自愈方法,这是一种”best-effort“形式的自愈,会尝试 kill 掉组件的进程,但可能失败
    uptimeFunc         func() (time.Duration, error)  // 获取组件的启动时间(启动后经过的时间)
    crictlPath         string // crictl 二进制文件路径,用于对 CRI(Container Runtime Interface) 组件执行健康检查
    healthCheckTimeout time.Duration // 健康检查超时时间
    coolDownTime       time.Duration // 服务启动后,在冷却时间内如果发现异常,不会尝试自动修复。超出冷却时间后才会尝试自动修复
    loopBackTime       time.Duration // 待检 journal 查日志的起始时间间隔,如果该值为0,则从组件启动的日志开始检查
    logPatternsToCheck map[string]int // 要检查的 journal 日志的正则表达式
}
执行流程
health-checker 的执行流程可以分为三个步骤:
调用 healthCheckFunc() 方法判断组件进程是否健康 获取组件近一段时间的 journal 日志,判断异常日志数量是否达到上限 如果前两步检查都未发现异常,则返回 true。否则,如果启动了自动修复机制,则调用 repairFunc() 尝试自愈
健康检查
func getHealthCheckFunc(hco *options.HealthCheckerOptions) func() (bool, error) {
    switch hco.Component {
    case types.KubeletComponent:
      // 访问 http://127.0.0.1:10248/healthz,判断 kubelet 是否健康
        return healthCheckEndpointOKFunc(types.KubeletHealthCheckEndpoint, hco.HealthCheckTimeout)
    case types.KubeProxyComponent:
      // 访问 http://127.0.0.1:10256/healthz,判断 kube-proxy 是否健康
        return healthCheckEndpointOKFunc(types.KubeProxyHealthCheckEndpoint, hco.HealthCheckTimeout)
    case types.DockerComponent:
        return func() (bool, error) { // 执行 docker ps 命令判断 Docker 是否健康
            if _, err := execCommand(hco.HealthCheckTimeout, getDockerPath(), "ps"); err != nil {
                return false, nil
            }
            return true, nil
        }
    case types.CRIComponent:
        return func() (bool, error) {// 执行 circtl --runtime-endpoint=unix:///var/run/containerd/containerd.sock --image-endpoint=unix:///var/run/containerd/containerd.sock
            if _, err := execCommand(hco.HealthCheckTimeout, hco.CriCtlPath, "--runtime-endpoint="+hco.CriSocketPath, "--image-endpoint="+hco.CriSocketPath, "pods"); err != nil {
                return false, nil
            }
            return true, nil
        }
    default:
        glog.Warningf("Unsupported component: %v", hco.Component)
    }

    return nil
}
组件自愈
func getRepairFunc(hco *options.HealthCheckerOptions) func() {
    switch hco.Component {
    case types.DockerComponent:
        // Use "docker ps" for docker health check. Not using crictl for docker to remove
        // dependency on the kubelet.
        return func() {
            execCommand(types.CmdTimeout, "pkill", "-SIGUSR1", "dockerd")
            execCommand(types.CmdTimeout, "systemctl", "kill", "--kill-who=main", hco.Service)
        }
    default:
        // Just kill the service for all other components
        return func() {
            execCommand(types.CmdTimeout, "systemctl", "kill", "--kill-who=main", hco.Service)
        }
    }
}
log-counter
依赖的插件是 journald,其作用是统计指定的 journal 日志中近一段时间满足正则匹配的历史日志条数。
命令行参数
| 参数名称 | 参数说明 | 默认值 |
|---|---|---|
| journald-source | The source configuration of journald, e.g., kernel, kubelet, dockerd, etc | |
| log-path | The log path that log watcher looks up | |
| lookback | The log path that log watcher looks up | |
| delay | The time duration log watcher delays after node boot time. This is useful when log watcher needs to wait for some time until the node is stable. | |
| pattern | The regular expression to match the problem in log. The pattern must match to the end of the line. | |
| count | The number of times the pattern must be found to trigger the condition | 1 |
执行流程
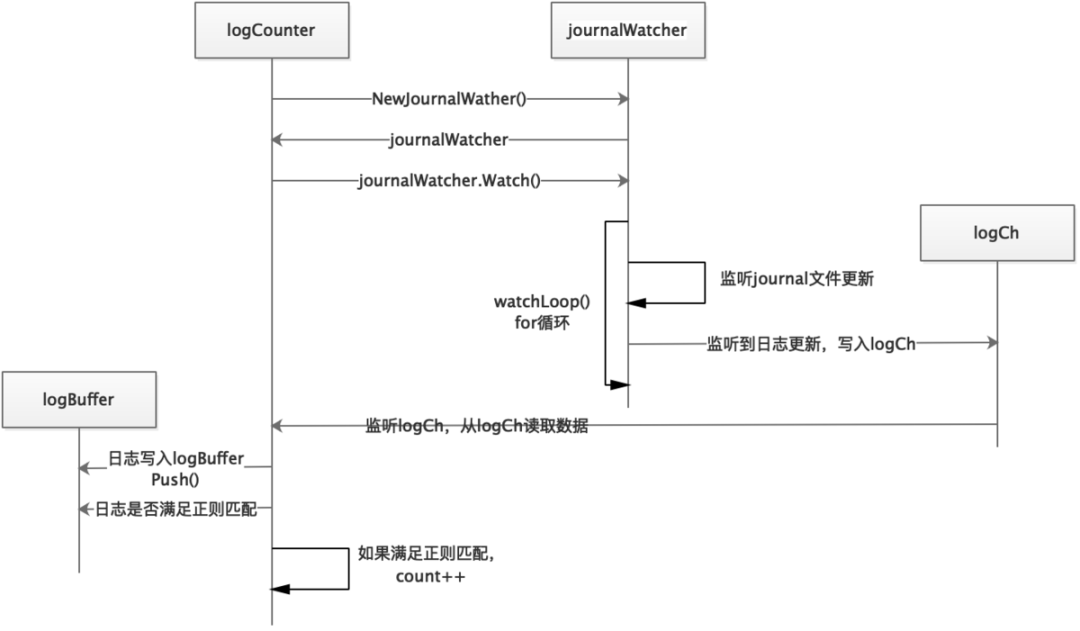
Count()
func (e *logCounter) Count() (count int, err error) {
    start := e.clock.Now()
    for {
        select {
        case log, ok := <-e.logCh:
            if !ok {
                err = fmt.Errorf("log channel closed unexpectedly")
                return
            }
            // 只统计 logCounter 启动之前的日志
            if start.Before(log.Timestamp) {
                return
            }
            e.buffer.Push(log)
            if len(e.buffer.Match(e.pattern)) != 0 {
                count++
            }
        case <-e.clock.After(timeout):
            // 如果超过一定时间没有新日志生成,则退出
            return
        }
    }
}
journal 日志检查
func checkForPattern(service, logStartTime, logPattern string, logCountThreshold int) (bool, error) {
  // 从 journal 日志中匹配符合规则的错误日志
    out, err := execCommand(types.CmdTimeout, "/bin/sh", "-c",
        // Query service logs since the logStartTime
        `journalctl --unit "`+service+`" --since "`+logStartTime+
            // 正则匹配
            `" | grep -i "`+logPattern+
            // 计算错误发生次数
            `" | wc -l`)
    if err != nil {
        return true, err
    }
    occurrences, err := strconv.Atoi(out)
    if err != nil {
        return true, err
    }
  // 如果错误日志数量超过阈值,则返回 false
    if occurrences >= logCountThreshold {
        glog.Infof("%s failed log pattern check, %s occurrences: %v", service, logPattern, occurrences)
        return false, nil
    }
    return true, nil
}
network_problem.sh
检查 conntrack table[20] 的使用率是否超过 90%
#!/bin/bash

# This plugin checks for common network issues.
# Currently only checks if conntrack table is more than 90% used.

readonly OK=0
readonly NONOK=1
readonly UNKNOWN=2

# "nf_conntrack" replaces "ip_conntrack" - support both
readonly NF_CT_COUNT_PATH='/proc/sys/net/netfilter/nf_conntrack_count'
readonly NF_CT_MAX_PATH='/proc/sys/net/netfilter/nf_conntrack_max'
readonly IP_CT_COUNT_PATH='/proc/sys/net/ipv4/netfilter/ip_conntrack_count'
readonly IP_CT_MAX_PATH='/proc/sys/net/ipv4/netfilter/ip_conntrack_max'

if [[ -f $NF_CT_COUNT_PATH ]] && [[ -f $NF_CT_MAX_PATH ]]; then
  readonly CT_COUNT_PATH=$NF_CT_COUNT_PATH
  readonly CT_MAX_PATH=$NF_CT_MAX_PATH
elif [[ -f $IP_CT_COUNT_PATH ]] && [[ -f $IP_CT_MAX_PATH ]]; then
  readonly CT_COUNT_PATH=$IP_CT_COUNT_PATH
  readonly CT_MAX_PATH=$IP_CT_MAX_PATH
else
  exit $UNKNOWN
fi

readonly conntrack_count=$(< $CT_COUNT_PATH) || exit $UNKNOWN
readonly conntrack_max=$(< $CT_MAX_PATH) || exit $UNKNOWN
readonly conntrack_usage_msg="${conntrack_count} out of ${conntrack_max}"

if (( conntrack_count > conntrack_max * 9 /10 )); then
  echo "Conntrack table usage over 90%: ${conntrack_usage_msg}"
  exit $NONOK
else
  echo "Conntrack table usage: ${conntrack_usage_msg}"
  exit $OK
fi
system-log-monitor
system-log-monitor 用于监控系统和内核日志,根据预定义规则来报告问题、指标。它支持基于文件的日志、Journald、kmsg。要监控其它日志,需要实现 LogWatcher 接口
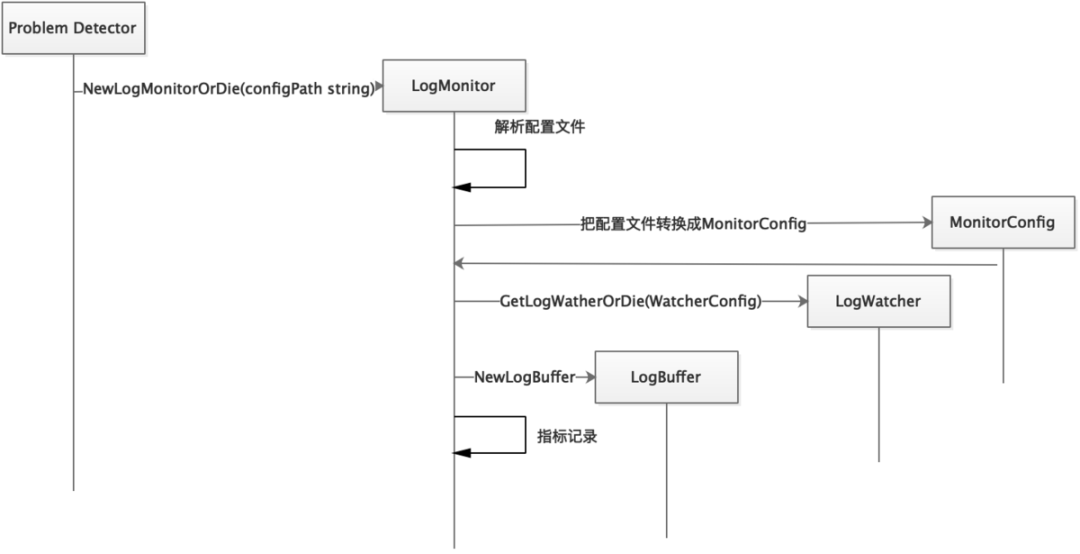
LogMonitor
type logMonitor struct {
    // 配置文件路径
    configPath string
    // 读取日志的逻辑委托给LogWatcher,这里解耦的目的是支持多种类型的日志
    watcher    watchertypes.LogWatcher
    // 日志缓冲,读取的日志在此等待处理
    buffer     LogBuffer
    // 对应配置文件中的字段
    config     MonitorConfig
    // 对应配置文件中的conditions字段
    conditions []types.Condition
    // 输入日志条目的通道
    logCh      <-chan *logtypes.Log
    // 输出状态的通道
    output     chan *types.Status
    // 用于控制此Monitor的生命周期
    tomb       *tomb.Tomb
}
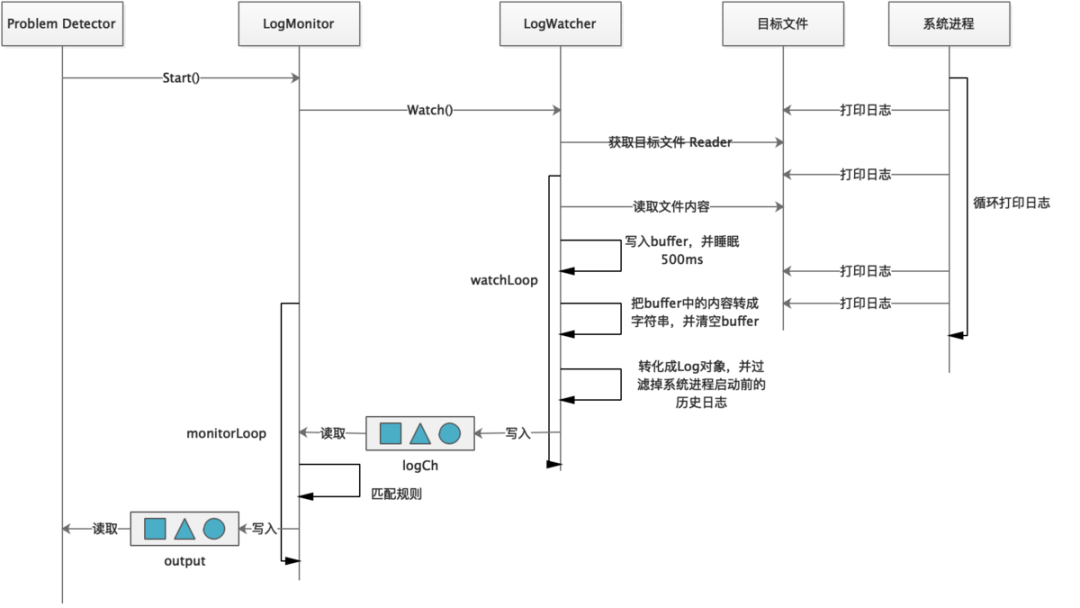
LogWatcher
LogWatcher 的主要作用的监听文件更新,并将追加的文件内容写入 LogBuffer 中供 LogMonitor 处理。NPD 中提供了三种 LogWatcher 的实现:
filelog:监听任意文本类型日志。 journald:监听 journald 日志。 kmsg:监听内核日志设备,如 /dev/kmsg。
LogWatcher 也需要在 init() 方法中完成注册。
type LogWatcher interface {
    // 开始监控日志,并通过通道输出日志
    Watch() (<-chan *types.Log, error)
    // 停止,注意释放打开的资源
    Stop()
}
filelog
filelog 通过监控指定的文件更新,并对日志内容进行正则匹配,以发现异常日志,从而判断组件是否正常。
{
    "plugin": "filelog",
    "pluginConfig": {
        "timestamp": "^time=\"(\\S*)\"",// 时间戳解析表达式
        "message": "msg=\"([^\n]*)\"",  // 日志解析表达式
        "timestampFormat": "2006-01-02T15:04:05.999999999-07:00" // 时间戳格式
    },
    "logPath": "/var/log/docker.log", // 日志路径
    "lookback": "5m", // 日志回溯时长
    "bufferSize": 10, // 缓冲大小(日志条数)
    "source": "docker-monitor",
    "conditions": [],
    "rules": [ // 健康检查规则
        {
            "type": "temporary",
            "reason": "CorruptDockerImage",
            "pattern": "Error trying v2 registry: failed to register layer: rename /var/lib/docker/image/(.+) /var/lib/docker/image/(.+): directory not empty.*"
        }
    ]
}
journald
journald 底层依赖 sdjournal 包,监控系统日志的更新,并且可以从指定的历史时间点开始读取。如果未指定 journal 日志路径,则从系统默认路径读取。读取到的日志会转换成 logtypes.Log 对象,并写入 logCh 通道中。journal 通过监控 journal 文件更新,并对日志内容进行正则匹配,以发现异常日志,从而判断组件是否正常。
{
    "plugin": "journald",
    "pluginConfig": {
        "source": "abrt-notification"
    },
    "logPath": "/var/log/journal", // journal 日志路径
    "lookback": "5m", // 日志回溯时长
    "bufferSize": 10, // log 缓存大小(日志条数)
    "source": "abrt-adaptor",
    "conditions": [],
    "rules": [ // 健康检查规则
        {
            "type": "temporary",
            "reason": "CCPPCrash",
            "pattern": "Process \\d+ \\(\\S+\\) crashed in .*"
        },
        {
            "type": "temporary",
            "reason": "UncaughtException",
            "pattern": "Process \\d+ \\(\\S+\\) of user \\d+ encountered an uncaught \\S+ exception"
        },
        {
            "type": "temporary",
            "reason": "XorgCrash",
            "pattern": "Display server \\S+ crash in \\S+"
        },
        {
            "type": "temporary",
            "reason": "VMcore",
            "pattern": "System encountered a fatal error in \\S+"
        },
        {
            "type": "temporary",
            "reason": "Kerneloops",
            "pattern": "System encountered a non-fatal error in \\S+"
        }
    ]
}
kmsg
kmsg 和 journald 的实现原理类似,它底层依赖 kmsgparser 包,实现内核日志的监控更新和回溯。默认的文件路径是 /dev/kmsg。kmsg 通过监控系统日志文件更新,并对日志内容进行正则匹配,以发现异常日志,从而判断组件是否正常。
{
    "plugin": "kmsg",
    "logPath": "/dev/kmsg", // 内核日志路径
    "lookback": "5m",  // 日志回溯时长
    "bufferSize": 10,  // 缓存大小(日志条数)
    "source": "kernel-monitor",
    "metricsReporting": true,
    "conditions": [
        {
            "type": "KernelDeadlock",
            "reason": "KernelHasNoDeadlock",
            "message": "kernel has no deadlock"
        },
        {
            "type": "ReadonlyFilesystem",
            "reason": "FilesystemIsNotReadOnly",
            "message": "Filesystem is not read-only"
        }
    ],
    "rules": [
        {
            "type": "temporary",
            "reason": "OOMKilling",
            "pattern": "Killed process \\d+ (.+) total-vm:\\d+kB, anon-rss:\\d+kB, file-rss:\\d+kB.*"
        },
        {
            "type": "temporary",
            "reason": "TaskHung",
            "pattern": "task [\\S ]+:\\w+ blocked for more than \\w+ seconds\\."
        },
        {
            "type": "temporary",
            "reason": "UnregisterNetDevice",
            "pattern": "unregister_netdevice: waiting for \\w+ to become free. Usage count = \\d+"
        },
        {
            "type": "temporary",
            "reason": "KernelOops",
            "pattern": "BUG: unable to handle kernel NULL pointer dereference at .*"
        },
        {
            "type": "temporary",
            "reason": "KernelOops",
            "pattern": "divide error: 0000 \\[#\\d+\\] SMP"
        },
        {
            "type": "temporary",
            "reason": "Ext4Error",
            "pattern": "EXT4-fs error .*"
        },
        {
            "type": "temporary",
            "reason": "Ext4Warning",
            "pattern": "EXT4-fs warning .*"
        },
        {
            "type": "temporary",
            "reason": "IOError",
            "pattern": "Buffer I/O error .*"
        },
        {
            "type": "temporary",
            "reason": "MemoryReadError",
            "pattern": "CE memory read error .*"
        },
        {
            "type": "permanent",
            "condition": "KernelDeadlock",
            "reason": "AUFSUmountHung",
            "pattern": "task umount\\.aufs:\\w+ blocked for more than \\w+ seconds\\."
        },
        {
            "type": "permanent",
            "condition": "KernelDeadlock",
            "reason": "DockerHung",
            "pattern": "task docker:\\w+ blocked for more than \\w+ seconds\\."
        },
        {
            "type": "permanent",
            "condition": "ReadonlyFilesystem",
            "reason": "FilesystemIsReadOnly",
            "pattern": "Remounting filesystem read-only"
        }
    ]
}
LogBuffer
LogBuffer 是一个可循环写入的日志队列,max 字段控制可记录日志的最大条数,当日志条数超过 max 时,就会从头覆盖写入。LogBuffer 也支持正则匹配 buffer 中的日志内容。
type LogBuffer interface {
    // 把日志写入 log buffer 中
    Push(*types.Log)
    // 对 buffer 中的日志进行正则匹配
    Match(string) []*types.Log
  // 把 log buffer 中的日志按时间由远到近连接成一个字符串
    String() string
}
实现原理
启动过程
执行过程
system-stats-monitor
将各种健康相关的统计信息报告为 Metrics
目前支持的组件仅仅有主机信息、磁盘:
disk/io_time 设备队列非空时间,毫秒 disk/weighted_io 设备队列非空时间加权,毫秒 disk/avg_queue_len 上次调用插件以来,平均排队请求数
使用标记禁用:disable_system_stats_monitor
cpuCollector:采集 CPU 相关指标信息。 diskCollector:采集磁盘相关指标信息。 hostCollector:采集宿主机相关指标信息。 memoryCollector:采集内存相关指标信息。 osFeatureCollector:采集系统属性相关指标。 netCollector:采集网络相关指标信息。
检查规则
自定义插件规则
CustomRule
// 自定义规则(插件),描述CPM如何调用插件,分析调用结果
type CustomRule struct {
    // 报告永久还是临时问题
    Type types.Type `json:"type"`
    // 此问题触发哪种NodeCondition,仅当永久问题才设置此字段
    Condition string `json:"condition"`
    // 问题的简短原因,对于永久问题,通常描述NodeCondition的一个子类型
    Reason string `json:"reason"`
    // 自定义插件(脚本)的文件路径
    Path string `json:"path"`
    // 传递给自定义插件的参数
    Args []string `json:"args"`
    // 自定义插件执行超时
    TimeoutString *string `json:"timeout"`
    Timeout *time.Duration `json:"-"`
}
示例
health-checker-kubelet.json[21]
系统日志监控规则
systemlogtypes.Rule
type Rule struct {
    // 报告永久还是临时问题
    Type types.Type `json:"type"`
    // 此问题触发哪种NodeCondition,仅当永久问题才设置此字段
    Condition string `json:"condition"`
    // 问题的简短原因,对于永久问题,通常描述NodeCondition的一个子类型
    Reason string `json:"reason"`
    // Pattern is the regular expression to match the problem in log.
    // Notice that the pattern must match to the end of the line.
    Pattern string `json:"pattern"`
}
示例
kernel-monitor.json[22]
异常上报
node-problem-detector 使用 Event 和 NodeCondition 将问题报告给 apiserver。
NodeCondition:导致节点无法处理于 Pod 生命周期的的永久性问题应报告为 NodeCondition。 Event:对 pod 影响有限的临时问题应作为 event 报告。
异常类型
temporary:致节点无法处理于 Pod 生命周期的的永久性问题 permanent:对 pod 影响有限的临时问题
指标上报
通过配置 metricsReporting 可以选择是否开启 System Log Monitor 的指标上报功能。该字段默认为 true。
临时异常只会上报 counter 指标,如下:
# HELP problem_counter Number of times a specific type of problem have occurred.
# TYPE problem_counter counter
problem_counter{reason="TaskHung"} 2
永久异常会上报 gauge 指标和 counter 指标,如下:
# HELP problem_counter Number of times a specific type of problem have occurred.
# TYPE problem_counter counter
problem_counter{reason="DockerHung"} 1
# HELP problem_gauge Whether a specific type of problem is affecting the node or not.
# TYPE problem_gauge gauge
problem_gauge{condition="KernelDeadlock",reason="DockerHung"} 1
Counter是一个累计类型的数据指标,它代表单调递增的计数器。`
 `Gauge是可以任意上下波动数值的指标类型。
指标
NPD 对指标这一概念也进行了封装,它依赖 OpenCensus 而不是 Prometheus 这样具体的实现的 API。
所有指标如下:
const (
    CPURunnableTaskCountID  MetricID = "cpu/runnable_task_count"
    CPUUsageTimeID          MetricID = "cpu/usage_time"
    CPULoad1m               MetricID = "cpu/load_1m"
    CPULoad5m               MetricID = "cpu/load_5m"
    CPULoad15m              MetricID = "cpu/load_15m"
    ProblemCounterID        MetricID = "problem_counter"
    ProblemGaugeID          MetricID = "problem_gauge"
    DiskIOTimeID            MetricID = "disk/io_time"
    DiskWeightedIOID        MetricID = "disk/weighted_io"
    DiskAvgQueueLenID       MetricID = "disk/avg_queue_len"
    DiskOpsCountID          MetricID = "disk/operation_count"
    DiskMergedOpsCountID    MetricID = "disk/merged_operation_count"
    DiskOpsBytesID          MetricID = "disk/operation_bytes_count"
    DiskOpsTimeID           MetricID = "disk/operation_time"
    DiskBytesUsedID         MetricID = "disk/bytes_used"
    HostUptimeID            MetricID = "host/uptime"
    MemoryBytesUsedID       MetricID = "memory/bytes_used"
    MemoryAnonymousUsedID   MetricID = "memory/anonymous_used"
    MemoryPageCacheUsedID   MetricID = "memory/page_cache_used"
    MemoryUnevictableUsedID MetricID = "memory/unevictable_used"
    MemoryDirtyUsedID       MetricID = "memory/dirty_used"
    OSFeatureID             MetricID = "system/os_feature"
    SystemProcessesTotal    MetricID = "system/processes_total"
    SystemProcsRunning      MetricID = "system/procs_running"
    SystemProcsBlocked      MetricID = "system/procs_blocked"
    SystemInterruptsTotal   MetricID = "system/interrupts_total"
    SystemCPUStat           MetricID = "system/cpu_stat"
    NetDevRxBytes           MetricID = "net/rx_bytes"
    NetDevRxPackets         MetricID = "net/rx_packets"
    NetDevRxErrors          MetricID = "net/rx_errors"
    NetDevRxDropped         MetricID = "net/rx_dropped"
    NetDevRxFifo            MetricID = "net/rx_fifo"
    NetDevRxFrame           MetricID = "net/rx_frame"
    NetDevRxCompressed      MetricID = "net/rx_compressed"
    NetDevRxMulticast       MetricID = "net/rx_multicast"
    NetDevTxBytes           MetricID = "net/tx_bytes"
    NetDevTxPackets         MetricID = "net/tx_packets"
    NetDevTxErrors          MetricID = "net/tx_errors"
    NetDevTxDropped         MetricID = "net/tx_dropped"
    NetDevTxFifo            MetricID = "net/tx_fifo"
    NetDevTxCollisions      MetricID = "net/tx_collisions"
    NetDevTxCarrier         MetricID = "net/tx_carrier"
    NetDevTxCompressed      MetricID = "net/tx_compressed"
)
其中 ProblemCounterID 和 ProblemGaugeID 是针对所有 Problem 的 Counter/Gauge,其他都是 SystemStatsMonitor 暴露的指标。
治愈系统
在 NPD 的术语中,治愈系统(Remedy System)是一个或一组进程,负责分析 NPD 检测出的问题,并且采取补救措施,让 K8S 集群恢复健康状态。
目前官方提及的治愈系统有只有 Draino。NPD 项目并没有提供对 Draino 的集成,你需要手工部署和配置 Draino。
Draino
Draino[23]是 Planet 开源的小项目,最初在 Planet 用于解决 GCE 上运行的 K8S 集群的持久卷相关进程(mkfs.ext4、mount 等)永久卡死在不可中断睡眠状态的问题。Draino 的工作方式简单粗暴,只是检测到 NodeCondition 并 Cordon、Drain 节点。
基于 Label 和 NodeCondition 自动的 Drain 掉故障 K8S 节点:
具有匹配标签的的 K8S 节点,只要进入指定的 NodeCondition 之一,立即禁止调度(Cordoned) 在禁止调度之后一段时间,节点被 Drain 掉
Draino 可以联用 Cluster Autoscaler,自动的终结掉 Drained 的节点。
在 Descheduler 项目成熟以后,可以代替 Draino。
参考文档
kubernetes addons 之 node-problem-detector[24] Kubernetes 故障检测和自愈[25]
引用链接
NodeCondition: https://links.jianshu.com/go?to=https%3A%2F%2Fkubernetes.io%2Fzh%2Fdocs%2Fconcepts%2Farchitecture%2Fnodes%2F%23condition
[2]Event: https://links.jianshu.com/go?to=https%3A%2F%2Fkubernetes.io%2Fdocs%2Freference%2Fgenerated%2Fkubernetes-api%2Fv1.22%2F%23event-v1-core
[3]https://github.com/kubernetes/node-problem-detector: https://links.jianshu.com/go?to=https%3A%2F%2Fgithub.com%2Fkubernetes%2Fnode-problem-detector
[4]config/kernel-monitor.json: https://links.jianshu.com/go?to=https%3A%2F%2Fgithub.com%2Fkubernetes%2Fnode-problem-detector%2Fblob%2Fmaster%2Fconfig%2Fkernel-monitor.json
[5]config/system-stats-monitor.json: https://links.jianshu.com/go?to=https%3A%2F%2Fgithub.com%2Fkubernetes%2Fnode-problem-detector%2Fblob%2Fmaster%2Fconfig%2Fsystem-stats-monitor.json
[6]config/custom-plugin-monitor.json: https://links.jianshu.com/go?to=https%3A%2F%2Fgithub.com%2Fkubernetes%2Fnode-problem-detector%2Fblob%2Fmaster%2Fconfig%2Fcustom-plugin-monitor.json
[7]http://APISERVER_IP:APISERVER_PORT?inClusterConfig=false: https://links.jianshu.com/go?to=http%3A%2F%2Fapiserver_ip%3AAPISERVER_PORT%2F%3FinClusterConfig%3Dfalse
[8]heapster: https://links.jianshu.com/go?to=https%3A%2F%2Fgithub.com%2Fkubernetes%2Fheapster%2Fblob%2Fmaster%2Fdocs%2Fsource-configuration.md%23kubernetes
[9]config/exporter/stackdriver-exporter.json: https://links.jianshu.com/go?to=https%3A%2F%2Fgithub.com%2Fkubernetes%2Fnode-problem-detector%2Fblob%2Fmaster%2Fconfig%2Fexporter%2Fstackdriver-exporter.json
[10]默认配置: https://links.jianshu.com/go?to=https%3A%2F%2Fgithub.com%2Fkubernetes%2Fnode-problem-detector%2Ftree%2Fv0.1%2Fconfig
[11]ConfigMap: https://links.jianshu.com/go?to=https%3A%2F%2Fkubernetes.io%2Fzh%2Fdocs%2Ftasks%2Fconfigure-pod-container%2Fconfigure-pod-configmap%2F
[12]https://km.sankuai.com/page/1072724542: https://links.jianshu.com/go?to=https%3A%2F%2Fkm.sankuai.com%2Fpage%2F1072724542
[13]Problem Daemon: https://links.jianshu.com/go?to=https%3A%2F%2Fkm.sankuai.com%2Fpage%2F1072601362
[14]Problem Daemon: https://links.jianshu.com/go?to=https%3A%2F%2Fkm.sankuai.com%2Fpage%2F1072601362
[15]Exporter: https://links.jianshu.com/go?to=https%3A%2F%2Fkm.sankuai.com%2Fpage%2F1072724542
[16]Exporter: https://links.jianshu.com/go?to=https%3A%2F%2Fkm.sankuai.com%2Fpage%2F1072724542
[17]Stackdriver: https://links.jianshu.com/go?to=https%3A%2F%2Fwww.infoq.cn%2Farticle%2F2018%2F05%2Fstackdriver-kubernetes
[18]https://km.sankuai.com/page/1074277220: https://links.jianshu.com/go?to=https%3A%2F%2Fkm.sankuai.com%2Fpage%2F1074277220
[19]conntrack table: https://links.jianshu.com/go?to=http%3A%2F%2Farthurchiao.art%2Fblog%2Fconntrack-design-and-implementation-zh%2F
[20]conntrack table: https://links.jianshu.com/go?to=http%3A%2F%2Farthurchiao.art%2Fblog%2Fconntrack-design-and-implementation-zh%2F
[21]health-checker-kubelet.json: https://links.jianshu.com/go?to=https%3A%2F%2Fgithub.com%2Fkubernetes%2Fnode-problem-detector%2Fblob%2Fmaster%2Fconfig%2Fhealth-checker-kubelet.json
[22]kernel-monitor.json: https://links.jianshu.com/go?to=https%3A%2F%2Fgithub.com%2Fkubernetes%2Fnode-problem-detector%2Fblob%2Fmaster%2Fconfig%2Fkernel-monitor.json
[23]Draino: https://links.jianshu.com/go?to=https%3A%2F%2Fgithub.com%2Fplanetlabs%2Fdraino
[24]kubernetes addons 之 node-problem-detector: https://links.jianshu.com/go?to=https%3A%2F%2Fzhuanlan.zhihu.com%2Fp%2F352965234
[25]Kubernetes 故障检测和自愈: https://links.jianshu.com/go?to=https%3A%2F%2Fblog.gmem.cc%2Fproblem-detection-and-auto-repairing-in-k8s
原文链接:https://www.jianshu.com/p/eeba98425307


你可能还喜欢
点击下方图片即可阅读


云原生是一种信仰 🤘
关注公众号
后台回复◉k8s◉获取史上最方便快捷的 Kubernetes 高可用部署工具,只需一条命令,连 ssh 都不需要!


点击 "阅读原文" 获取更好的阅读体验!
发现朋友圈变“安静”了吗?