
Prometheus 监控体系
共 22064字,需浏览 45分钟
· 2021-07-19
1 概述
1.1 主要功能
多维 数据模型(时序由 metric 名字和 k/v 的 labels 构成)。
灵活的查询语句(PromQL)。
无依赖存储,支持 local 和 remote 不同模型。
采用 http 协议,使用 pull 模式,拉取数据,简单易懂。
监控目标,可以采用服务发现或静态配置的方式。
支持多种统计数据模型,图形化友好。
1.2 核心组件
Prometheus Server, 主要用于抓取数据和存储时序数据,另外还提供查询和 Alert Rule 配置管理。
client libraries,用于对接 Prometheus Server, 可以查询和上报数据。
push gateway ,用于批量,短期的监控数据的汇总节点,主要用于业务数据汇报等。
各种汇报数据的 exporters ,例如汇报机器数据的 node_exporter, 汇报 MongoDB 信息的 MongoDB exporter 等等。
用于告警通知管理的 alertmanager 。
1.3 基础架构
一图胜千言,先来张官方的架构图
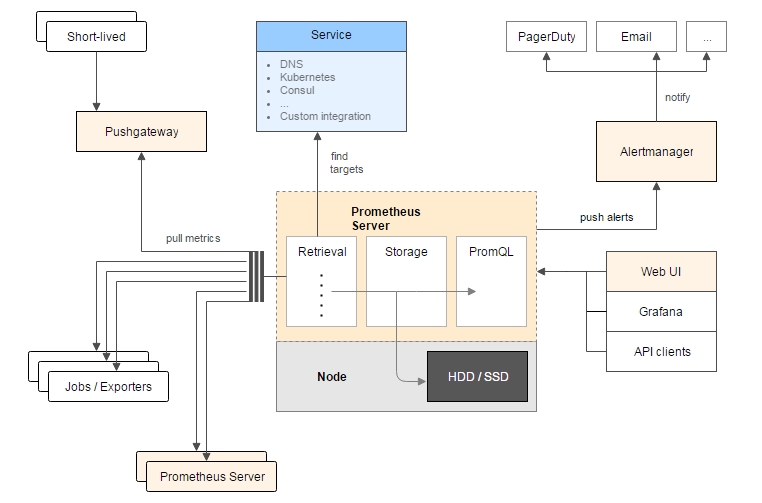
从这个架构图,也可以看出 Prometheus 的主要模块包含, Server, Exporters, Pushgateway, PromQL, Alertmanager, WebUI 等。
它大致使用逻辑是这样:
Prometheus server 定期从静态配置的 targets 或者服务发现的 targets 拉取数据。
当新拉取的数据大于配置内存缓存区的时候,Prometheus 会将数据持久化到磁盘(如果使用 remote storage 将持久化到云端)。
Prometheus 可以配置 rules,然后定时查询数据,当条件触发的时候,会将 alert 推送到配置的 Alertmanager。
Alertmanager 收到警告的时候,可以根据配置,聚合,去重,降噪,最后发送警告。
可以使用 API, Prometheus Console 或者 Grafana 查询和聚合数据。
1.4 注意
Prometheus 的数据是基于时序的 float64 的值,如果你的数据值有更多类型,无法满足。
Prometheus 不适合做审计计费,因为它的数据是按一定时间采集的,关注的更多是系统的运行瞬时状态以及趋势,即使有少量数据没有采集也能容忍,但是审计计费需要记录每个请求,并且数据长期存储,这个和 Prometheus 无法满足,可能需要采用专门的审计系统。
2 BO关注项
2.1 数据收集方式
使用 pull 模式,拉取数据。
2.2 数据格式
Prometheus 时序格式与 OpenTSDB 相似:
1 | <metric name>{<label name>=<label value>, ...} |
其中包含时序名字以及时序的标签。
2.2.1 时序 4 种类型
Prometheus 时序数据分为 Counter, Gauge, Histogram, Summary 四种类型。
2.2.1.1 Counter
Counter 表示收集的数据是按照某个趋势(增加/减少)一直变化的,我们往往用它记录服务请求总量,错误总数等。
例如 Prometheus server 中 http_requests_total, 表示 Prometheus 处理的 http 请求总数,我们可以使用 delta, 很容易得到任意区间数据的增量,这个会在 PromQL 一节中细讲。
1 | # HELP http_requests_total Total number of HTTP requests made. |
2.2.1.2 Gauge
Gauge 表示搜集的数据是一个瞬时的,与时间没有关系,可以任意变高变低,往往可以用来记录内存使用率、磁盘使用率等。
例如 Prometheus server 中 go_goroutines, 表示 Prometheus 当前 goroutines 的数量。
1 | # HELP go_goroutines Number of goroutines that currently exist. |
2.2.1.3 Histogram
Histogram 由 <basename>_bucket{le="<upper inclusive bound>"},<basename>_bucket{le="+Inf"}, <basename>_sum,<basename>_count 组成,主要用于表示一段时间范围内对数据进行采样,(通常是请求持续时间或响应大小),并能够对其指定区间以及总数进行统计,通常我们用它计算分位数的直方图。
例如 Prometheus server 中 prometheus_local_storage_series_chunks_persisted, 表示 Prometheus 中每个时序需要存储的 chunks 数量,我们可以用它计算待持久化的数据的分位数。
1 | # HELP prometheus_tsdb_compaction_chunk_range Final time range of chunks on their first compaction |
2.2.1.4 Summary
Summary 和 Histogram 类似,由 <basename>{quantile="<φ>"},<basename>_sum,<basename>_count 组成,主要用于表示一段时间内数据采样结果,(通常是请求持续时间或响应大小),它直接存储了 quantile 数据,而不是根据统计区间计算出来的。
例如 Prometheus server 中 prometheus_target_interval_length_seconds。
1 | # HELP prometheus_target_interval_length_seconds Actual intervals between scrapes. |
2.2.1.5 Histogram vs Summary
都包含
<basename>_sum,<basename>_countHistogram 需要通过
<basename>_bucket计算 quantile, 而 Summary 直接存储了 quantile 的值。
2.2.3 数据存储方式
数据存在promethues自身的数据库,以数据文件的形式存储,有自身的查询方式:promql;详见https://songjiayang.gitbooks.io/prometheus/content/promql/summary.html
2.2.4 数据输出方式
agent:被动拉取;
promethues server:主动拉取客户端的数据。promethues将拉取到的数据存到data/目录。(除了 promethues 前台的PromQ查询页面,应该有某种工具可以直接在命令行查询promethues的历史数据(暂未找到);多种导出工具,可以支持Prometheus存储数据转化为HAProxy、StatsD、Graphite等工具所需要的数据存储格式(工具未研究过)。)
2.2.5 agent部署方式
promethues未提供自动部署agent的功能。
2.2.6 任务下发方式
agent每个周期固定采集设备的指定指标,若要自定义采集某些指标则需要修改agent源码。
promethues server拉取数据的任务在prometheus.yml配置。
3 promethues组件及部署
3.1 promethues server
3.1.1 部署
tar包解压即可用
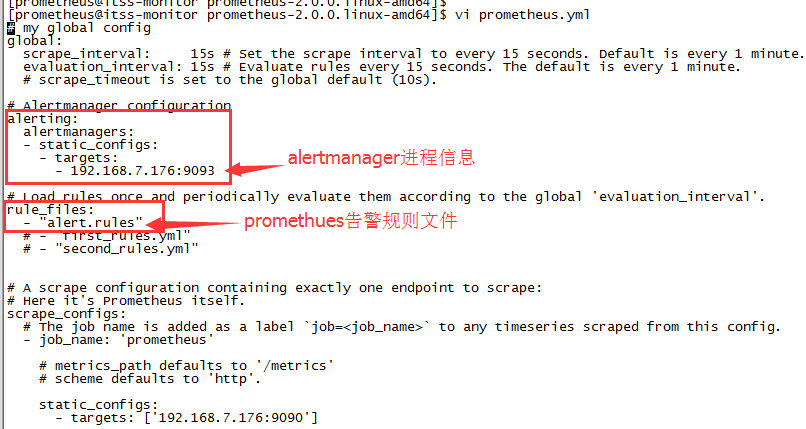
3.1.2 PROMETHEUS.YML配置举例
1 | global: |
3.1.3 命令
[chenrj@kfapp01 prometheus-2.0.0.linux-amd64]$ ./prometheus -h
usage: prometheus [
The Prometheus monitoring server
Flags:
-h, –help Show context-sensitive help (also try –help-long and –help-man).
3.1.4 前台地址
http://192.168.7.40:9090/graph
默认9090端口
3.2 grafana
http://192.168.7.40:3000
端口默认3000,
用户密码:admin/admin
./grafana-server
3.3 主机节点
http://10.140.20.142:9100/metrics
3.4 redis节点
http://10.140.20.143:9121/metrics
3.5 elasticsearch节点
http://10.140.20.146:9108/metrics
4 数据查询
4.1 http方式查询promethues数据
https://prometheus.io/docs/prometheus/latest/querying/api/#querying-metadata
4.1.1 即时查询
1 | GET /api/v1/query |
URL查询参数:
query=<string>:普罗米修斯表达查询字符串。time=<rfc3339 | unix_timestamp>:评估时间戳。可选的。timeout=<duration>:评价超时。可选的。默认为,并通过价值上限-query.timeout标志。
若省略时间time测试,则默认使用服务器时间
例:查询2018-01-16T03:12:51.781这个时刻go_memstats_frees_total的值
[logstash@CP-ITSM-OMC-ZSC05 supervisor]$ curl ‘http://10.140.20.146:9090/api/v1/query?query=go_memstats_frees_total&time=2018-01-16T03:12:51.781Z‘
{“status”:”success”,”data”:{“resultType”:”vector”,”result”:[{“metric”:{“name“:”go_memstats_frees_total”,”instance”:”10.140.20.142:9100”,”job”:”node”},”value”:[1516072371.781,”5599415948”]},{“metric”:{“name“:”go_memstats_frees_total”,”instance”:”10.140.20.143:9100”,”job”:”node”},”value”:[1516072371.781,”5152870637”]},{“metric”:{“name“:”go_memstats_frees_total”,”instance”:”10.140.20.143:9108”,”job”:”elasticsearch_exporter”},”value”:[1516072371.781,”1385642849”]},{“metric”:{“name“:”go_memstats_frees_total”,”instance”:”10.140.20.143:9121”,”job”:”redis_exporter_143”},”value”:[1516072371.781,”159639669”]},{“metric”:{“name“:”go_memstats_frees_total”,”instance”:”10.140.20.144:9100”,”job”:”node”},”value”:[1516072371.781,”5167404030”]},{“metric”:{“name“:”go_memstats_frees_total”,”instance”:”10.140.20.144:9108”,”job”:”elasticsearch_exporter”},”value”:[1516072371.781,”1383957758”]},{“metric”:{“name“:”go_memstats_frees_total”,”instance”:”10.140.20.144:9121”,”job”:”redis_exporter_144”},”value”:[1516072371.781,”373190465”]},{“metric”:{“name“:”go_memstats_frees_total”,”instance”:”10.140.20.145:9100”,”job”:”node”},”value”:[1516072371.781,”5124941908”]},{“metric”:{“name“:”go_memstats_frees_total”,”instance”:”10.140.20.145:9108”,”job”:”elasticsearch_exporter”},”value”:[1516072371.781,”1370943258”]},{“metric”:{“name“:”go_memstats_frees_total”,”instance”:”10.140.20.146:9100”,”job”:”node”},”value”:[1516072371.781,”4850755799”]},{“metric”:{“name“:”go_memstats_frees_total”,”instance”:”10.140.20.146:9108”,”job”:”elasticsearch_exporter”},”value”:[1516072371.781,”1370683906”]},{“metric”:{“name“:”go_memstats_frees_total”,”instance”:”localhost:9090”,”job”:”prometheus”},”value”:[1516072371.781,”2299674805”]}]}}
注:”value”:[时间戳,”对应值”]
4.1.2 范围查询
1 | GET /api/v1/query_range |
URL查询参数:
query=<string>:普罗米修斯表达查询字符串。start=<rfc3339 | unix_timestamp>:开始时间戳。end=<rfc3339 | unix_timestamp>:结束时间戳。step=<duration>:查询分辨率步的宽度。timeout=<duration>:评价超时。可选的。默认为,并通过价值上限-query.timeout标志。
例:时间在2018-01-01T20:10:30.781到2018-01-01T20:11:00.781范围内,间隔15秒,up的数据
[logstash@CP-ITSM-OMC-ZSC05 supervisor]$ curl ‘http://10.140.20.146:9090/api/v1/query_range?query=up&start=2018-01-01T20:10:30.781Z&end=2018-01-01T20:11:00.781Z&step=15s‘
{“status”:”success”,”data”:{“resultType”:”matrix”,”result”:[{“metric”:{“name“:”up”,”instance”:”localhost:9090”,”job”:”prometheus”},”values”:[[1514837430.781,”1”],[1514837445.781,”1”],[1514837460.781,”1”]]},{“metric”:{“name“:”up”,”instance”:”localhost:9100”,”job”:”node”},”values”:[[1514837430.781,”0”],[1514837445.781,”0”],[1514837460.781,”0”]]}]}}
4.2 http查询方式作用未知系列??
QUERYING METADATA
Finding series by label matchers
The following endpoint returns the list of time series that match a certain label set.
1 | GET /api/v1/series |
URL query parameters:
match[]=<series_selector>: Repeated series selector argument that selects the series to return. At least onematch[]argument must be provided.start=<rfc3339 | unix_timestamp>: Start timestamp.end=<rfc3339 | unix_timestamp>: End timestamp.
The data section of the query result consists of a list of objects that contain the label name/value pairs which identify each series.
The following example returns all series that match either of the selectors up or process_start_time_seconds{job="prometheus"}:
1 | $ curl -g 'http://localhost:9090/api/v1/series?match[]=up&match[]=process_start_time_seconds{job="prometheus"}' |
Querying label values
The following endpoint returns a list of label values for a provided label name:
1 | GET /api/v1/label/<label_name>/values |
The data section of the JSON response is a list of string label names.
This example queries for all label values for the job label:
1 | $ curl http://localhost:9090/api/v1/label/job/values |
EXPRESSION QUERY RESULT FORMATS
Expression queries may return the following response values in the result property of the data section. <sample_value> placeholders are numeric sample values. JSON does not support special float values such as NaN, Inf, and -Inf, so sample values are transferred as quoted JSON strings rather than raw numbers.
Range vectors
Range vectors are returned as result type matrix. The corresponding result property has the following format:
1 | [ |
Instant vectors
Instant vectors are returned as result type vector. The corresponding result property has the following format:
1 | [ |
Scalars
Scalar results are returned as result type scalar. The corresponding result property has the following format:
1 | [ <unix_time>, "<scalar_value>" ] |
Strings
String results are returned as result type string. The corresponding result property has the following format:
1 | [ <unix_time>, "<string_value>" ] |
TARGETS
This API is experimental as it is intended to be extended with targets dropped due to relabelling in the future.
The following endpoint returns an overview of the current state of the Prometheus target discovery:
1 | GET /api/v1/targets |
Currently only the active targets are part of the response.
1 | $ curl http://localhost:9090/api/v1/targets |
ALERTMANAGERS
This API is experimental as it is intended to be extended with Alertmanagers dropped due to relabelling in the future.
The following endpoint returns an overview of the current state of the Prometheus alertmanager discovery:
1 | GET /api/v1/alertmanagers |
Currently only the active Alertmanagers are part of the response.
1 | $ curl http://localhost:9090/api/v1/alertmanagers |
查询指标标签:curl -g ‘http://192.168.7.40:9090/api/v1/series?match[]=up&match[]=process_start_time_seconds{job="prometheus"}‘
查询标签 {“status”:”success”,”data”:[]}[logstash@CP-ITSM-OMC-ZSC05 supervisor]$ curl http://10.140.20.146:9090/api/v1/label/job/values
{“status”:”success”,”data”:[“elasticsearch_exporter”,”node”,”prometheus”,”redis_exporter”,”redis_exporter_143”,”redis_exporter_144”]}
4.3 查询节点数据
查询节点exporter的所有数据:curl -s http://192.168.7.40:9100/metrics
5 exporter格式
基于协议缓冲区格式 和 文本格式
客户端可以暴露promethues无法解析的其他格式
5.1 基于协议缓冲区格式 和 文本格式 的区别
| Protocol buffer format | Text format | |
|---|---|---|
| Inception | April 2014 | April 2014 |
| Supported in | Prometheus version >=0.4.0 | Prometheus version >=0.4.0 |
| Transmission | HTTP | HTTP |
| Encoding | 32-bit varint-encoded record length-delimited) Protocol Buffer messages of type io.prometheus.client.MetricFamily | UTF-8, \n line endings |
| HTTP Content-Type | application/vnd.google.protobuf; proto=io.prometheus.client.MetricFamily; encoding=delimited | text/plain; version=0.0.4 (A missing version value will lead to a fall-back to the most recent text format version.) |
| Optional HTTP Content-Encoding | gzip | gzip |
| Advantages | Cross-platformSizeEncoding and decoding costsStrict schemaSupports concatenation and theoretically streaming (only server-side behavior would need to change) | Human-readableEasy to assemble, especially for minimalistic cases (no nesting required)Readable line by line (with the exception of type hints and docstrings) |
| Limitations | Not human-readable | VerboseTypes and docstrings not integral part of the syntax, meaning little-to-nonexistent metric contract validationParsing cost |
| Supported metric primitives | CounterGaugeHistogramSummaryUntyped | CounterGaugeHistogramSummaryUntyped |
| Compatibility | Version 0.0.3 protocol buffers are also valid version 0.0.4 protocol buffers. | none |
5.2 基于协议缓冲区格式
Reproducible sorting of the protocol buffer fields in repeated expositions is preferred but not required, i.e. do not sort if the computational cost is prohibitive.
Each MetricFamily within the same exposition must have a unique name. Each Metric within the same MetricFamily must have a unique set of LabelPair fields. Otherwise, the ingestion behavior is undefined.
5.3 文本类型格式
#打头的是注释行(除非#之后的第一个标记是HELP或TYPE)。
HELP行:可能包含任何UTF-8字符序列(在指标名称之后),但反斜杠和换行字符必须分别转义为\\和\ n。对于相同的指标名称,只能有一条HELP行,一个指标只能有一个HELP行。
TYPE行:TPYE后的第一个参数是指标名,第二个参数是数据类型(可以是counter, gauge, histogram, summary, untyped)。相同的指标名称,只能有一个TYPE行。如果指标名称没有TYPE行,则该类型设置为无类型。
格式:
1 | metric_name [ |
label_value可以是任何UTF-8格式的内容,但反斜杠、双引号、换行符 必须转义成
1 | \\ \" \\n |
histogram(直方图) summary(汇总)类型的特别格式:
需要单独一行xxx_sum;
需要单独一行xxx_count;
Each quantile of a summary named x is given as a separate sample line with the same name x and a label {quantile=”y”};
A histogram must have a bucket with {le=”+Inf”}. Its value must be identical to the value of x_count;
histogram类型必须要有{le=”+Inf”},并且值要和xxx_count一致;
5.4 文本类型格式举例
1 | # HELP http_requests_total The total number of HTTP requests. |
6 导出器exporter
6.1 概述
指标名,一般为导出程序名称作为前缀,例如, haproxy_up;
度量标准必须使用基本单位(例如秒,字节),并保留将其转换为更具可读性的图形工具;
指标有效字符:`[a-zA-Z0-9:_]` ,其他任何字符都要用下划线_代替;
指标后缀_sum, _count, _bucket and _total 只可用在Summaries、 Histograms 、 Counters
7 告警alertmanager程序
概述:
promethues:根据配置文件prometheus.yml的rule_files告警规则,将告警信息存到promethues的磁盘,供promethues的前台页面查看;根据配置文件prometheus.yml的alerting(配置altermanager进程的ip 端口信息),将告警信息发送altermanager进程上。
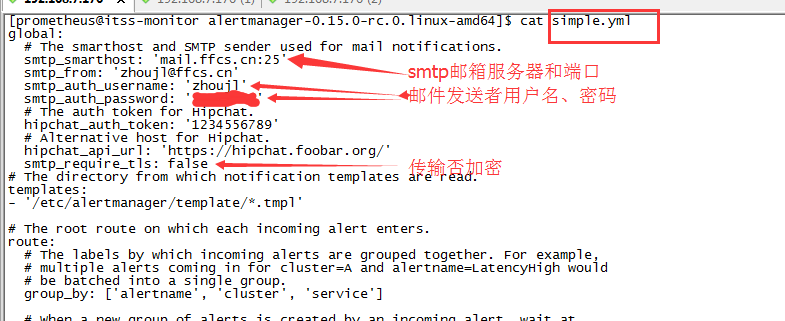
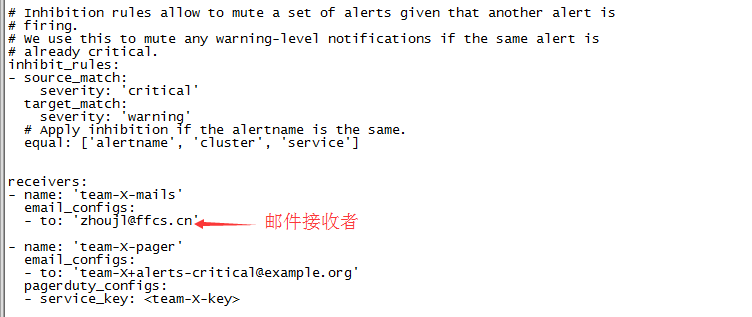
altermanager:接收promethues发来的告警信息,存在磁盘中供altermanager进程的前台查看;同时根据altermanager的告警配置文件simple.yml发送邮件等提醒。
7.1 promethues告警配置举例
7.2 promethues告警规则配置文件举例

alert:自定义的告警含义简写
expor:告警条件,如上图的node_forks为具体mertics里的指标
for:周期
labels:severity,在alertmanager前台页面可以根据severity条件来查询告警信息
annotations:summary写些较详细的告警信息
7.3 alertmanager告警发送邮件提示
7.4 启动alertmanager
nohup ./alertmanager –config.file=simple.yml &
alertmanager前台:http://192.168.7.176:9093/
7.5通过其他方式告警
HIPCHAT_CONFIG:
是一款能够在苹果mac平台上运行的社交聊天软件,HipChat的功能和QQ相似,集聊天、视频、语音等功能于一身,不同之处在于HipChat界面更加的简洁、操作更加的流畅。
PAGERDUTY_CONFIG:
是一款能够在服务器出问题时发送提醒的软件。在发生问题时,提醒的方式包括屏幕显示、电话呼叫、短信通知、电邮通知等,而且在无人应答时还会自动将提醒级别提高。PagerDuty 不是免费的。
PUSHOVER_CONFIG:
是一款网络通知推送服务,类似ifttt或脚本服务,你可以将需要推送的服务设置好后,遇到情况将把通知自动推送到你的安卓手机。
SLACK_CONFIG:
slack是聊天群组 + 大规模工具集成 + 文件整合 + 统一搜索。截至2014年底,Slack 已经整合了电子邮件、短信、Google Drives、Twitter、Trello、Asana、GitHub 等 65 种工具和服务,可以把各种碎片化的企业沟通和协作集中到一起。
1 | # Whether or not to notify about resolved alerts. |
OPSGENIE_CONFIG :
集成电话短信邮件等等
VICTOROPS_CONFIG:
聊天应用
HTTP_CONFIG:
A http_config allows configuring the HTTP client that the receiver uses to communicate with HTTP-based API services.
8 问题笔记
8.1已解决
prometheus浏览器查询不到exporter指标数据,但是浏览器exporter的mertic有指标数据。原因是时间不同步
8.2 未解决
source: http://zhoujinl.github.io/2018/03/25/prometheus/

喜欢,在看