 生信宝典
生信宝典


本文采用circlize包自带的示例数据绘制Circos图,简要描述了circlize包的用法,以及几个常用参数的作用。
# 本计算机的R的版本:
.libPaths()
## [1] "C:/Program Files/R/R-4.0.4/library"
## [2] "C:/Users/HP/Documents/R/win-library/4.0"# R-4.0.3
# [1] "C:/Users/ACER/Documents/R/win-library/4.0"
# [2] "C:/Program Files/R/R-4.0.3/library"
# 安装新的R包只会默认安装到上述路径中。
# 安装circlize包
options("repos" = c(CRAN="http://mirrors.tuna.tsinghua.edu.cn/CRAN/"))
if (! require(circlize)) {
install.packages('circlize')
}## Loading required package: circlize## Warning: package 'circlize' was built under R version 4.0.5## ========================================
## circlize version 0.4.12
## CRAN page: https://cran.r-project.org/package=circlize
## Github page: https://github.com/jokergoo/circlize
## Documentation: https://jokergoo.github.io/circlize_book/book/
##
## If you use it in published research, please cite:## Gu, Z. circlize implements and enhances circular visualization
## in R. Bioinformatics 2014.
##
## This message can be suppressed by:
## suppressPackageStartupMessages(library(circlize))
## ========================================
library(circlize)1 | 使用测试数据绘图
获取测试绘图的数据:
一般以bed格式给出,前三列一般是坐标,后面可以增加任意列作为注释。
函数generateRandomBed用于获取示例的bed数据
bed = generateRandomBed(nr = 200)
head(bed)
## chr start end value1
## 1 chr1 1265305 23689474 -0.3692290
## 2 chr1 33693147 34684697 0.1979085
## 3 chr1 46407775 50257809 -0.2200499
## 4 chr1 50933154 50945647 -0.1620185
## 5 chr1 53258978 54441031 1.2335410
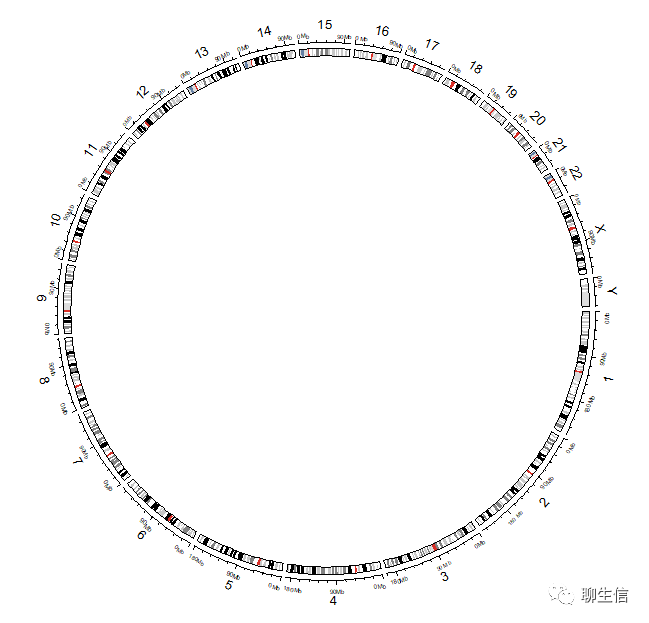
## 6 chr1 59225767 66683215 0.2868235绘制基因组(人类),版本为hg38 :
使用circos.initializeWithIdeogram函数,其参数species的帮助:
Abbreviations of species. e.g. hg19 for human, mm10 for mouse. If this value is specified, the function will download cytoBand.txt.gz from UCSC website automatically. If there is no cytoband for user’s species, it will keep on trying to download chromInfo file. Pass to read.cytoband or read.chromInfo.
circos.clear() # 绘图初始化
circos.initializeWithIdeogram(species = "hg38")
注意:后续的绘图函数都依赖于circos.initializeWithIdeogram
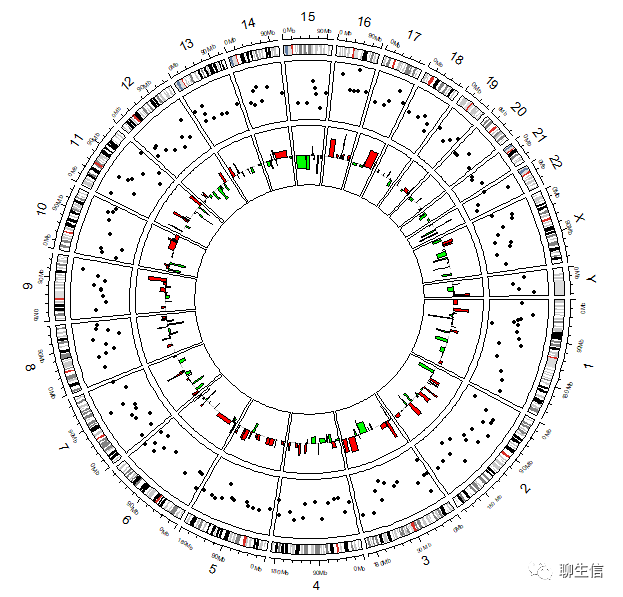
添加SNV、INDEL的信息,以点图展示,基于上面生成的bed数据:
circos.clear() # 绘图初始化
circos.initializeWithIdeogram(species = "hg38")circos.genomicTrack(bed,
panel.fun = function(region, value, ...) {
circos.genomicPoints(region, value, pch = 16, cex = 0.5, col = 1)})

添加CNV
circos.clear() # 绘图初始化
circos.initializeWithIdeogram(species = "hg38")circos.genomicTrack(bed,
panel.fun = function(region, value, ...) {
circos.genomicPoints(region, value, pch = 16, cex = 0.5, col = 1)})circos.genomicTrack(bed,
panel.fun = function(region, value, ...) {
circos.genomicRect(region, value, ytop.column = 1, ybottom = 0,
col = ifelse(value[[1]] > 0, "red", "green"), ...)
circos.lines(CELL_META$cell.xlim, c(0, 0), lty = 2, col = "#00000040")})
# 大于阈值(例如0)即为红色柱子,否则为绿色柱子
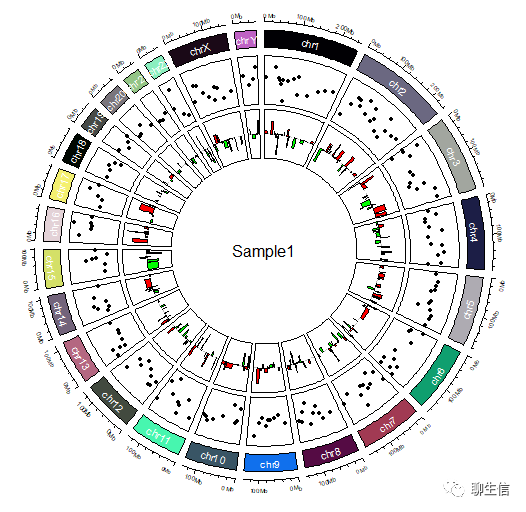
示例数据绘图——高级
circos.clear()
circos.par("start.degree" = 90)
circos.par("gap.degree" = rep(c(2, 2), 12), ADD = TRUE)
circos.initializeWithIdeogram(species = "hg38", plotType = c("axis", "labels"))
text(0, 0, "Sample1", cex = 1)
# 添加SNV、INDEL的信息:
circos.genomicTrack(bed,
panel.fun = function(region, value, ...) {
circos.genomicPoints(region, value, pch = 16, cex = 0.5, col = 1)})
# 添加CNV:
circos.genomicTrack(bed,
panel.fun = function(region, value, ...) {
circos.genomicRect(region, value, ytop.column = 1, ybottom = 0,
col = ifelse(value[[1]] > 0, "red", "green"), ...)
circos.lines(CELL_META$cell.xlim, c(0, 0), lty = 2, col = "#00000040")})
# 大于阈值(例如0)即为红色柱子,否则为绿色柱子

set.seed(50)
bed = generateRandomBed(nr = 200)
circos.clear()
circos.par("start.degree" = 90)
circos.par("gap.degree" = rep(c(2, 2), 12), ADD = TRUE)
circos.initializeWithIdeogram(species = "hg38", plotType = c("axis"))
text(0, 0, "Sample1", cex = 1)
# 染色体使用不同颜色的方框表示:
circos.track(ylim = c(0, 1), panel.fun = function(x, y) {
chr = CELL_META$sector.index
xlim = CELL_META$xlim
ylim = CELL_META$ylim
circos.rect(xlim[1], 0, xlim[2], 1, col = rand_color(24))
circos.text(mean(xlim), mean(ylim), chr, cex = 0.6, col = "white",
facing = "inside", niceFacing = TRUE)
}, track.height = 0.1, bg.border = NA)
# 添加SNV、INDEL的信息:
circos.genomicTrack(bed,
                    panel.fun = function(region, value, ...) {
                      circos.genomicPoints(region, value, pch = 16, cex = 0.5, col = 1)})
# 添加CNV:
circos.genomicTrack(bed,
                    panel.fun = function(region, value, ...) {
                      circos.genomicRect(region, value, ytop.column = 1, ybottom = 0,
                                         col = ifelse(value[[1]] > 0, "red", "green"), ...)
                      circos.lines(CELL_META$cell.xlim, c(0, 0), lty = 2, col = "#00000040")
})
# 大于阈值(例如0)即为红色柱子,否则为绿色柱子
# bed(文件多样本value的合并)热图在内层:
circos.clear()
circos.initializeWithIdeogram()
bed = generateRandomBed(nr = 100, nc = 4)
col_fun = colorRamp2(c(-1, 0, 1), c("green", "black", "red"))
circos.genomicHeatmap(bed, col = col_fun, side = "inside", border = "white")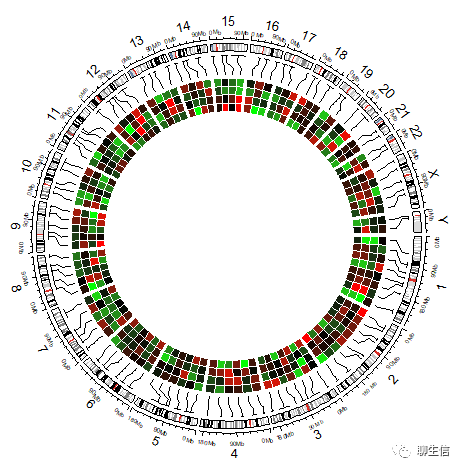
# bed(文件多样本value的合并)热图在外层:
circos.clear()
circos.initializeWithIdeogram(plotType = NULL)
circos.genomicHeatmap(bed, col = col_fun, side = "outside",
    line_col = as.numeric(factor(bed[[1]])))
circos.genomicIdeogram()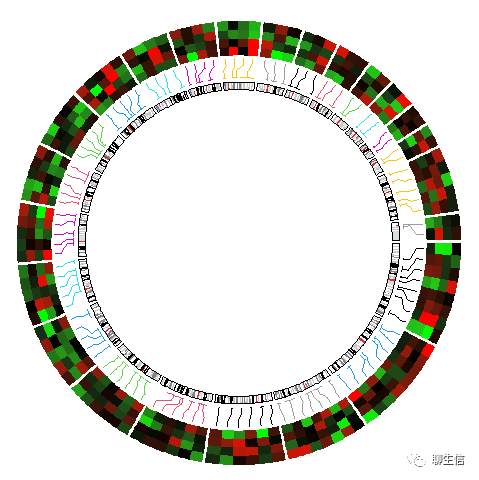
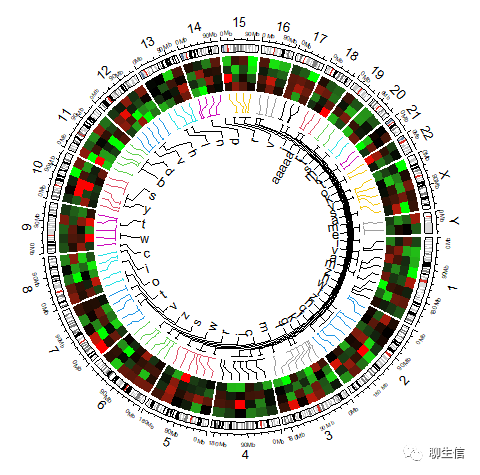
# 加Label:
circos.clear()
circos.initializeWithIdeogram()
bed.1 = generateRandomBed(nr = 100, nc = 4)
circos.genomicHeatmap(bed.1, col = col_fun, side = "outside",
line_col = as.numeric(factor(bed[[1]])))
bed.2 = generateRandomBed(nr = 50, fun = function(k) sample(letters, k, replace = TRUE))
bed.2[1, 4] = "aaaaa"
circos.genomicLabels(bed.2, labels.column = 4, side = "inside")
# circos.genomicIdeogram()
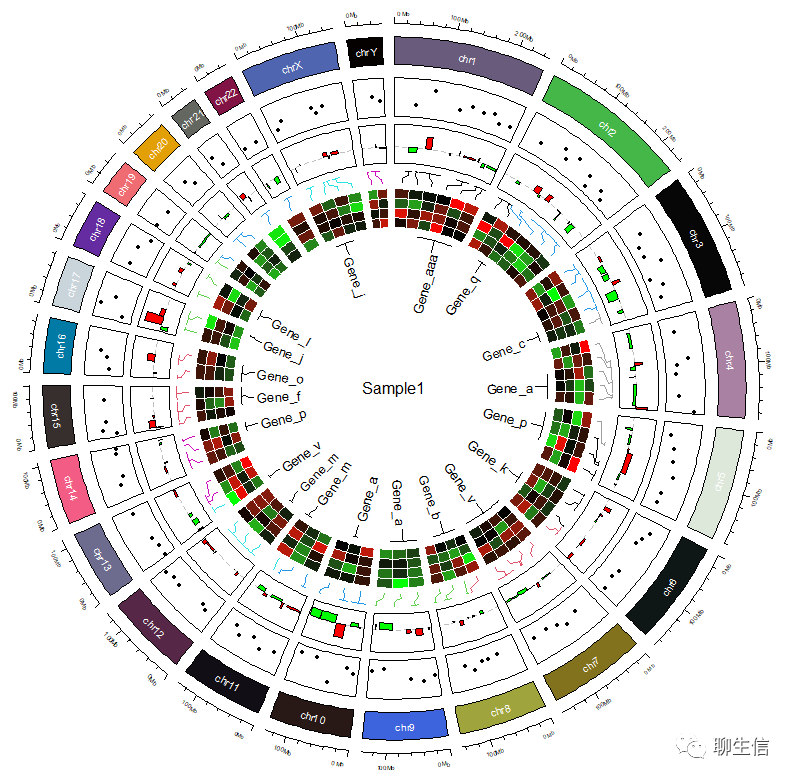
2 | 示例代码汇总
rm(list = ls())
set.seed(100)

bed = generateRandomBed(nr = 100)
col_fun = colorRamp2(c(-1, 0, 1), c("green", "black", "red"))
# col_fun = colorRamp2(c(-1, 0, 1), c("navy", "grey", "firebrick3"))

circos.clear()

#pdf("./Circos.hg38.pdf")


circos.par("start.degree" = 90)
circos.par("gap.degree" = rep(c(2, 2), 12), ADD = TRUE)
circos.initializeWithIdeogram(species = "hg38", plotType = c("axis"))
text(0, 0, "Sample1", cex = 1)

####### 染色体使用不同颜色的方框表示:
circos.track(ylim = c(0, 1), panel.fun = function(x, y) {
    chr = CELL_META$sector.index
    xlim = CELL_META$xlim
    ylim = CELL_META$ylim
    circos.rect(xlim[1], 0, xlim[2], 1, col = rand_color(24))
    circos.text(mean(xlim), mean(ylim), chr, cex = 0.6, col = "white",
        facing = "inside", niceFacing = TRUE)
}, track.height = 0.1, bg.border = NA)

####### 添加SNV、INDEL的信息:
circos.genomicTrack(bed,
                    panel.fun = function(region, value, ...) {
                      circos.genomicPoints(region, value, pch = 16, cex = 0.5, col = 1)},
                    stack = F, track.height = 0.1)

####### 添加CNV:
circos.genomicTrack(bed,
                    panel.fun = function(region, value, ...) {
                      circos.genomicRect(region, value, ytop.column = 1, ybottom = 0,
                                         col = ifelse(value[[1]] > 0, "red", "green"), ...)
                      circos.lines(CELL_META$cell.xlim, c(0, 0), lty = 2, col = "#00000040")
                    }, stack = F, track.height = 0.1)
# 大于阈值(例如0)即为红色柱子,否则为绿色柱子

####### 热图:
bed.1 = generateRandomBed(nr = 70, nc = 4)
# bed.1 = bed.1[1:10, ]
circos.genomicHeatmap(bed.1, col = col_fun, side = "inside", border = "white",
                      connection_height = mm_h(2),heatmap_height = 0.1,
    line_col = as.numeric(factor(bed[[1]])))
####### Label
bed.2 = generateRandomBed(nr = 10, fun = function(k) sample(letters, k, replace = TRUE))
bed.2[1, 4] = "aaa"
bed.2$value1 = paste0("Gene_",bed.2$value1)
circos.genomicLabels(bed.2, labels.column = 4,connection_height = mm_h(2),labels_height =cm_h(1.0), side = "inside")# circos.genomicIdeogram()
# dev.off()
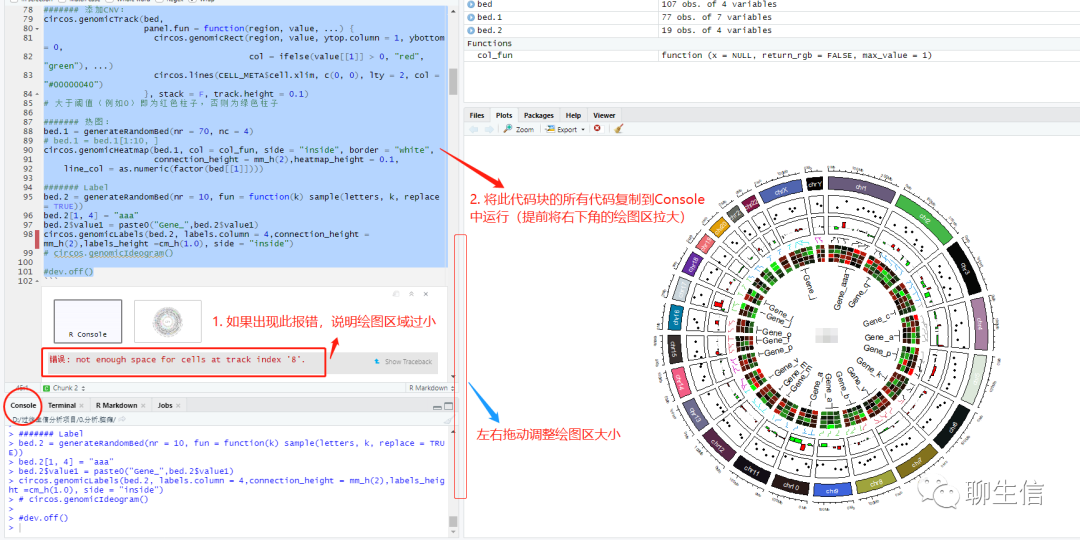
如果您在绘制图中出现如下报错:

是由于画布空间不足,可以将整块代码复制到Console中运行:
撰写:叶明皓 校对:宋红卫

往期精品(点击图片直达文字对应教程)
|
|
|
|
|
|
|
|
|
|
|
|
|
|
|
|
|
|
|
|
|
|
|
|
|
|
|
|


后台回复“生信宝典福利第一波”或点击阅读原文获取教程合集