
prometheus告警
写点笔记
共 2332字,需浏览 5分钟
· 2021-06-23
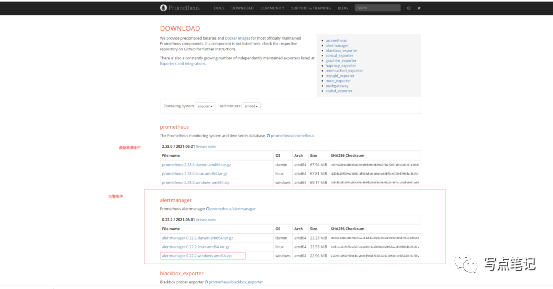
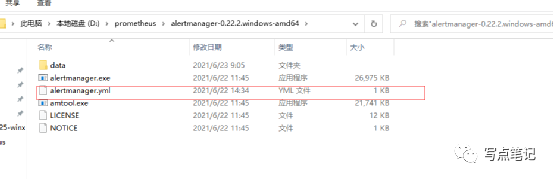
下载好altermanager之后,我们解压。其中的altermanager.yml是altermanager的配置文件。主要用来管理告警信息发送的规则,也就是说给谁发,用那种方式。
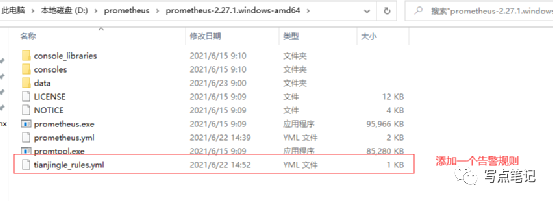
这块作者简单测试了一下监控mysql的线程数的告警。首先配置一下prometheus的数据收集的规则和push告警信息的地址。
groups:- name: test-mysql-rulerules:- alert: "连接数报警"expr: mysql_global_variables_mysqlx_max_connections > 90 #连接数大于90就告警for: 1slabels:severity: warningannotations:summary: "服务名:{{$labels.alertname}}"description: "业务msyql连接数不够报警: 当前值为:{{ $value }}"value: "{{ $value }}"
在prometheus配置文件中添加这个告警规则
# my global configglobal:scrape_interval: 15s # Set the scrape interval to every 15 seconds. Default is every 1 minute.evaluation_interval: 15s # Evaluate rules every 15 seconds. The default is every 1 minute.# scrape_timeout is set to the global default (10s).# Alertmanager configurationalerting:alertmanagers:- static_configs:- targets: ["localhost:9093"] #发送到altermanager的告警分析中# Load rules once and periodically evaluate them according to the global 'evaluation_interval'.rule_files:- "tianjingle_rules.yml"# Here it's Prometheus itself.scrape_configs:# The job name is added as a label `job=` to any timeseries scraped from this config.- job_name: 'prometheus'static_configs:- targets: ['localhost:9090']# 添加msyql的监控- job_name: 'mysql'# 静态添加nodestatic_configs:# 指定监控端- targets: ['localhost:9104']- job_name: 'bounter-monitor'scrape_interval: 5smetrics_path: '/actuator/prometheus'static_configs:- targets: ['localhost:8081']
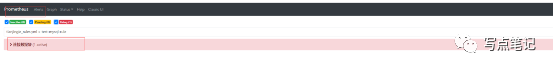
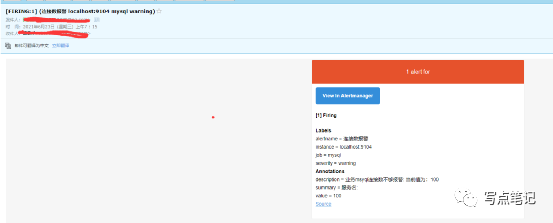
配置好上述配置之后对prometheus重启。并在prometheus的alter栏目中查看告警是否触发。发现已经触发了告警配置。
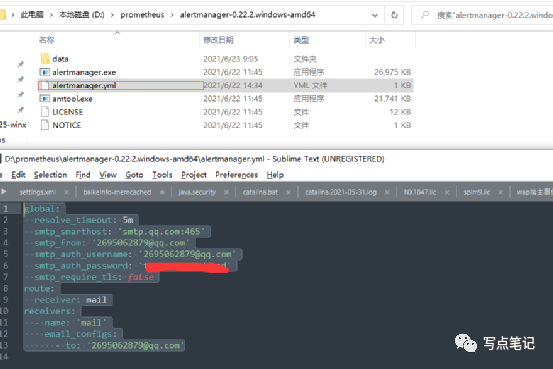
global:resolve_timeout: 5msmtp_smarthost: 'smtp.qq.com:465'smtp_from: '2695062879@qq.com'smtp_auth_username: '2695062879@qq.com'smtp_auth_password: '********'smtp_require_tls: falseroute:receiver: mailreceivers:name: 'mail'email_configs:to: '2695062879@qq.com'
配置好qq邮箱的报警提醒之后,我们重启altermanager。然后看一下是否会收到报警的邮件。稍等片刻,在邮箱中收到了邮件,如图。
早~
评论
搞懂 Prometheus 告警神器 Alertmanager
作者:吴叶磊转自:https://aleiwu.com/post/alertmanager警报是监控系统中必不可少的一块, 当然了, 也是最难搞的一块. 我们乍一想, 警报似乎很简单一件事:假如发生了异常情况, 发送或邮件/消息通知给某人或某频道一...
DevOps技术栈
0