 大邓和他的Python


一、实现效果
1. python代码
具体python代码实现,可关注菜J学Python后回复0215获得。
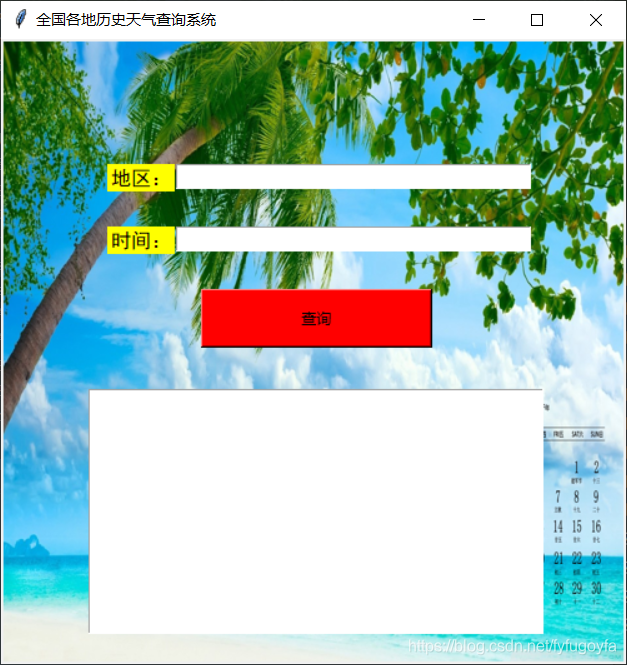
2. 运行效果
运行效果如下:
二、基本思路
导入用到的库
import requests
from lxml import etree
import re
import tkinter as tk
from PIL import Image, ImageTk
from xpinyin import Pinyin
1. 爬虫部分
目标url:https://lishi.tianqi.com/
该网站提供了全国34个省、市所属的2290个地区的历史天气预报查询,数据来源于城市当天的天气信息,可以查询到历史天气气温,历史风向,历史风力等历史天气状况。
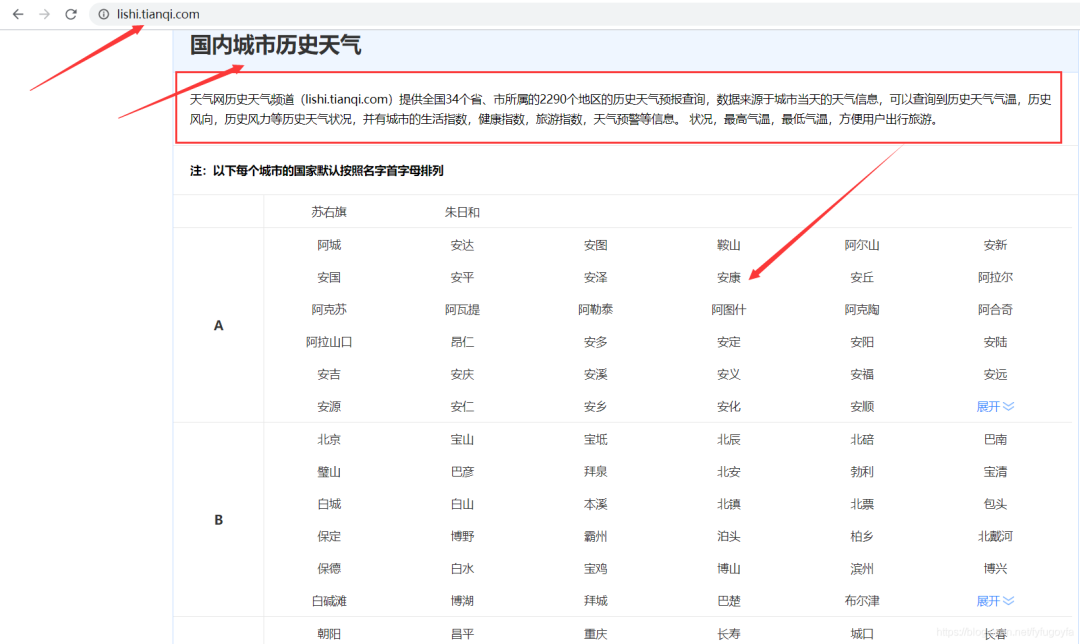
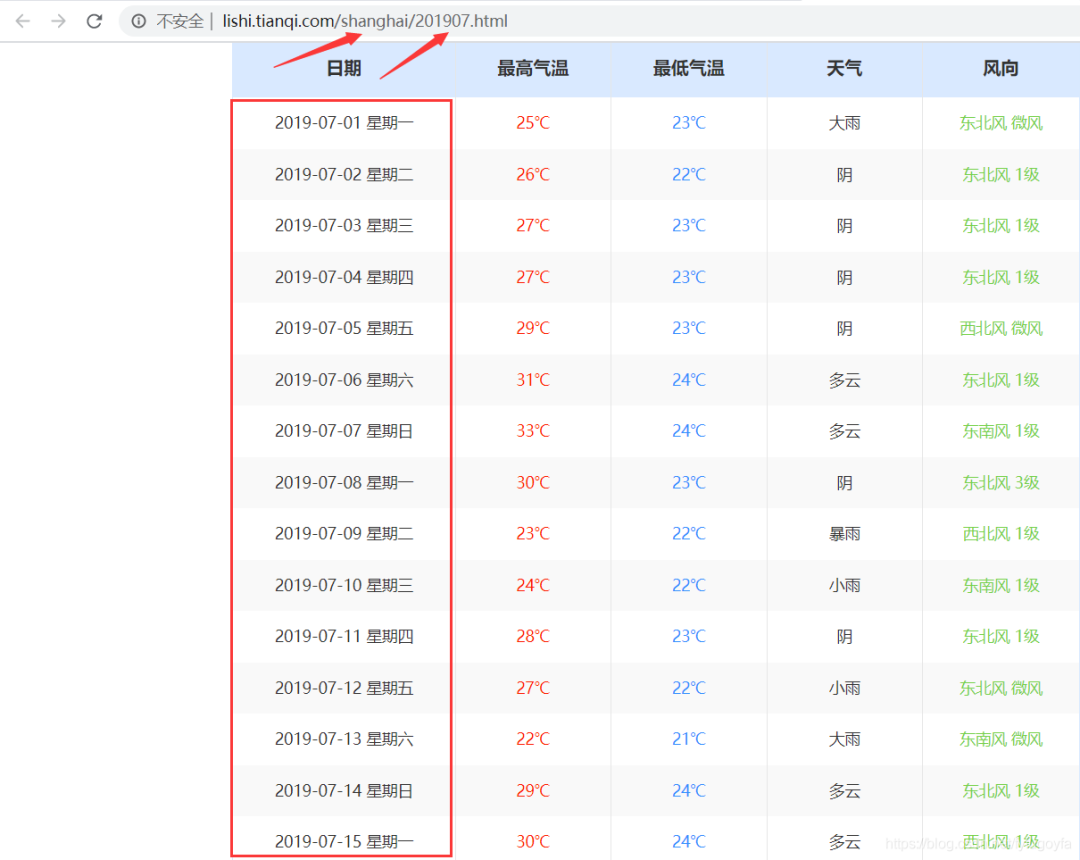
分析网页可以发现,某个地区、某个月的所有天气数据的url为:https://lishi.tianqi.com/ + 地区名字的拼音 + '/' + 年月.html。根据用户输入的地区和时间,进行字符串的处理,构造出url,用于request请求有该月所有天气信息的页面,获取响应后Xpath定位提取用户输入的要查询的日期的天气信息,查询结果显示在tkinter界面。
爬虫代码如下:
def spider():
    headers = {
        'user-agent': 'Mozilla/5.0 (Windows NT 6.2; WOW64) AppleWebKit/535.24 (KHTML, like Gecko) Chrome/19.0.1055.1 Safari/535.24',
        "referer": "https://lishi.tianqi.com/chengdu/index.html"
    }
    p = Pinyin()
    place = ''.join(p.get_pinyin(b1.get()).split('-'))           # 获取地区文本框的输入  变为拼音
    # 处理用户输入的时间
    # 规定三种格式都可以 2018/10/1  2018年10月1日  2018-10-1
    date = b2.get()   # 获取时间文本框的输入
    if '/' in date:
        tm_list = date.split('/')
    elif '-' in date:
        tm_list = date.split('-')
    else:
        tm_list = re.findall(r'\d+', date)

    if int(tm_list[1]) < 10:       # 1-9月  前面加 0
        tm_list[1] = f'0{tm_list[1]}'
    # 分析网页发现规律   构造url
    # 直接访问有该月所有天气信息的页面 提高查询效率
    url = f"https://lishi.tianqi.com/{place}/{''.join(tm_list[:2])}.html"
    resp = requests.get(url, headers=headers)
    html = etree.HTML(resp.text)
    # xpath定位提取该日天气信息
    info = html.xpath(f'//ul[@class="thrui"]/li[{int(tm_list[2])}]/div/text()')
    # 输出信息格式化一下
    info1 = ['日期:', '最高气温:', '最低气温:', '天气:', '风向:']
    datas = [i + j for i, j in zip(info1, info)]
    info = '\n'.join(datas)
    t.insert('insert', '        查询结果如下        \n\n')
    t.insert('insert', info)
    print(info)
2. tkinter界面
代码如下:
def get_image(file_nam, width, height):
    im = Image.open(file_nam).resize((width, height))
    return ImageTk.PhotoImage(im)


win = tk.Tk()
# 设置窗口title和大小
win.title('全国各地历史天气查询系统')
win.geometry('500x500')

# 画布  设置背景图片
canvas = tk.Canvas(win, height=500, width=500)
im_root = get_image('test.jpg', width=500, height=500)
canvas.create_image(250, 250, image=im_root)
canvas.pack()

# 单行文本
L1 = tk.Label(win, bg='yellow', text="地区:", font=("SimHei", 12))
L2 = tk.Label(win, bg='yellow', text="时间:", font=("SimHei", 12))
L1.place(x=85, y=100)
L2.place(x=85, y=150)

# 单行文本框  可采集键盘输入
b1 = tk.Entry(win, font=("SimHei", 12), show=None, width=35)
b2 = tk.Entry(win, font=("SimHei", 12), show=None, width=35)
b1.place(x=140, y=100)
b2.place(x=140, y=150)

# 设置查询按钮  点击 调用爬虫函数实现查询
a = tk.Button(win, bg='red', text="查询", width=25, height=2, command=spider)
a.place(x=160, y=200)

# 设置多行文本框  宽 高  文本框中字体  选中文字时文字的颜色
t = tk.Text(win, width=30, height=8, font=("SimHei", 18), selectforeground='red')  # 显示多行文本
t.place(x=70, y=280)

# 进入消息循环
win.mainloop()
tkinter界面效果如下:
结语
以上就是这篇文章的全部内容了,希望本文的内容对大家的学习或者工作具有一定的参考学习价值,谢谢大家对小编的支持。
获得本文完整代码
链接:https://pan.baidu.com/s/1afMkyQygyHbSdpOZBo3OCw 密码:7par
近期文章
Python网络爬虫与文本数据分析 bsite库 | 采集B站视频信息、评论数据 爬虫实战 | 采集&可视化知乎问题的回答 pdf2docx库 | 转文件格式,支持抽取文件中的表格数据 rpy2库 | 在jupyter中调用R语言代码 tidytext | 耳目一新的R-style文本分析库 reticulate包 | 在Rmarkdown中调用Python代码 plydata库 | 数据操作管道操作符>> plotnine: Python版的ggplot2作图库 七夕礼物 | 全网最火的钉子绕线图制作教程 读完本文你就了解什么是文本分析 文本分析在经管领域中的应用概述 综述:文本分析在市场营销研究中的应用 plotnine: Python版的ggplot2作图库 小案例: Pandas的apply方法 stylecloud:简洁易用的词云库 用Python绘制近20年地方财政收入变迁史视频 Wow~70G上市公司定期报告数据集 漂亮~pandas可以无缝衔接Bokeh YelpDaset: 酒店管理类数据集10+G
“分享”和“在看”是更好的支持!